Prompts to measure AEO and SEO performance together
- Six copy-paste prompts help you measure answer engine optimization (AEO) and search engine optimization (SEO) together.
- Pair each SEO metric with an AEO counterpart, then report both per URL.
- Track AI Overview impressions in Search Console next to citation rate and mention rate.
- Close each month with a joint narrative and a shared definitions doc.
Rankings and clicks miss part of your search story. AI answers in Google, ChatGPT, and Perplexity shape demand before anyone clicks. You need prompts to measure AEO and SEO performance together on one page set.
AirOps joins AI citations with Search Console and Google Analytics 4 (GA4) data per URL. This library gives you six prompts that do the same join on your own exports. Each prompt names its inputs from Google Search Console (GSC), GA4, and your AI tracker, plus its output format.
How do I measure AEO and SEO performance together?
Pair each SEO metric with an AEO counterpart, then report both against one page and prompt set. Shared URLs and a fixed prompt list keep the two views comparable.
- Pick one page set, such as your top 50 URLs by organic clicks.
- Map a fixed list of tracked prompts to those pages.
- Report GSC clicks and impressions beside citations and mentions from your AI tracker.
- Compare both views on the same 90-day rolling window.
Clicks alone undercount your reach on AI-heavy queries. Pew Research Center tracked this in 2025. Google searchers who saw an AI summary clicked a traditional result in 8% of visits.
Without a summary, searchers clicked a result in 15% of visits. That gap shows up as falling CTR on pages that hold their rank. Your report needs an answer metric next to every click metric to explain the drop.
The six prompts below cover the full joint measurement cycle. Run them in order the first time, then reuse them monthly.
| Prompt | Use it when | Output |
|---|---|---|
| 1. SEO vs AEO metric map | You need one shared metric list | Four-column metric table |
| 2. AI Overview tracking plan | You add AI Overview signals to GSC reports | Signal, source, and cadence table |
| 3. Joint dashboard spec | You brief an analyst or dashboard owner | Panel list with owners |
| 4. Baseline and data source audit | You start tracking or switch tools | Baseline table and fix list |
| 5. Monthly joint narrative | You write the monthly SEO update | Summary under 300 words |
| 6. Metric governance doc | Two reports show different numbers | Definitions table with denominators |
Every prompt in this kit reports on a fixed prompt set. A changing prompt list hides real movement in your citation numbers. It also breaks month-over-month comparisons in your narrative.
Rank and citation need separate tracking. AirOps' 2026 AI search study found roughly 60% of AI Overview citations came from URLs outside the organic top 20. Weekly citation checks catch that gap before your monthly report.
Prompt 1: map each SEO metric to an AEO counterpart
SEO metrics measure ranked pages and clicks, and generative engine optimization (GEO) and AEO metrics measure presence inside generated answers. Our guide to SEO vs GEO metrics compares the two in full.
Your AEO vs SEO metrics map pairs each click metric with an answer metric. The table shows the five pairs to start with.
| SEO metric | AEO counterpart | What it tells you | Source |
|---|---|---|---|
| Average position | Citation rate | How often answers cite your URL | GSC and AI tracker |
| Impressions | Mention rate | How often answers name your brand | GSC and AI tracker |
| Organic clicks | AI referral sessions | Visits that AI platforms send you | GSC and GA4 |
| Organic share of voice | AI share of voice | Your share of answers against competitors | Rank tracker and AI tracker |
| Click-through rate (CTR) | Clicks on cited queries | Whether citations still earn visits | GSC and AI tracker |
Prompt 1 builds this map from your own exports. Paste the exports for one date range before you run it.
You are an SEO analyst. Build a metric map from my exports. Inputs: [paste GSC performance export], [paste GA4 AI referral report], and [paste AI visibility export with citations and mentions]. Pair each SEO metric with its AEO counterpart. Explain what each pair tells me in one sentence. Name the data source for each metric. Return a four-column table: SEO metric, AEO counterpart, What it tells you, Source. Flag any metric my exports cannot fill.- Run it once per site and reuse the table each quarter.
- Use exports from the same 90-day window.
- Delete rows your stack has no data for.
The output gives you one shared vocabulary for SEO and AEO reporting.
What AI Overview visibility metrics should I track?
Track AI Overview impressions, citation rate, mention rate, and click-through on cited queries. Each signal answers a different question about the same query set.
| Signal | Where to get it | Cadence |
|---|---|---|
| AI Overview and AI Mode impressions | GSC generative AI performance report | Weekly |
| Citation rate per prompt | AI visibility tracker | Weekly |
| Mention rate per prompt | AI visibility tracker | Weekly |
| Clicks on cited queries | GSC Performance report, Web search type | Monthly |
| AI referral sessions | GA4 session source | Monthly |
Search Console now reports AI impressions in their own view. The generative AI performance report covers AI Overviews and AI Mode. It shows impressions only, so you pair it with citation rate from your tracker.
Prompt 2 turns these signals into a tracking plan for your pages.
You are an SEO lead planning AI Overview tracking. Inputs: [paste GSC generative AI export by page], [paste GSC Web export], and [paste AI visibility export by prompt]. Match each page to its tracked prompts. List each signal, its source, and its review cadence. Mark pages with AI impressions and no citations. Return a table with columns Signal, Where to get it, Cadence. Then add a bullet list of the five pages to fix first.Clicks on these queries fall fast. In 2025, Seer Interactive found organic click-through rate fell 61% on queries with AI Overviews. Citation rate shows whether you still earn a place in the answer.
- Start with pages that hold AI impressions and zero citations.
- Review citation rate weekly, because answers shift between runs.
- Add clicks on cited queries monthly to spot CTR loss.
Read the signals in pairs, never one at a time. Each combination points to a different fix on the page.
- Rising AI impressions with flat citations means answers cite other pages for your queries.
- Steady citations with falling clicks means the answer satisfies the searcher on Google.
- Mentions without citations means answers name your brand and link to third-party pages.
- Falling AI impressions with a steady rank means Google shows fewer AI Overviews for that query.
The plan gives you the signals and the sources behind each one. For the citation rate and mention rate formulas behind this plan, use the AEO metrics guide.
Prompts to build a joint SEO and AEO dashboard
A joint dashboard puts rankings, clicks, citations, and AI referrals on one URL-level view. A unified SEO and AEO dashboard ends the monthly merge of three separate tools.
Prompt 3 writes the dashboard spec your analyst builds from.
You are a business intelligence (BI) analyst building a unified SEO and AEO dashboard. Inputs: [list your data sources], [paste your top 50 URLs], and [paste your tracked prompt list]. Design one URL-level dashboard. Include panels for rankings, clicks, citations, mentions, AI share of voice, and AI referral traffic. Give each panel its metrics, data source, and owner. Return a table with columns Panel, Metrics, Data source, Owner. Then add one paragraph on the join key.| Panel | Metrics | Data source | Owner |
|---|---|---|---|
| Search performance | Clicks, impressions, and average position | GSC | SEO lead |
| AI Overview exposure | AI Overview and AI Mode impressions | GSC generative AI report | SEO lead |
| Answer presence | Citation rate and mention rate | AI visibility tracker | Content lead |
| Competitive share | AI share of voice by prompt | AI visibility tracker | SEO lead |
| AI referrals | AI referral sessions and conversions | GA4 | Analytics lead |
AI referral traffic now earns its own panel. Similarweb data shows AI platforms averaged 770.7M referral visits a month worldwide in the year ending May 2026. That figure rose 117.4% year over year.
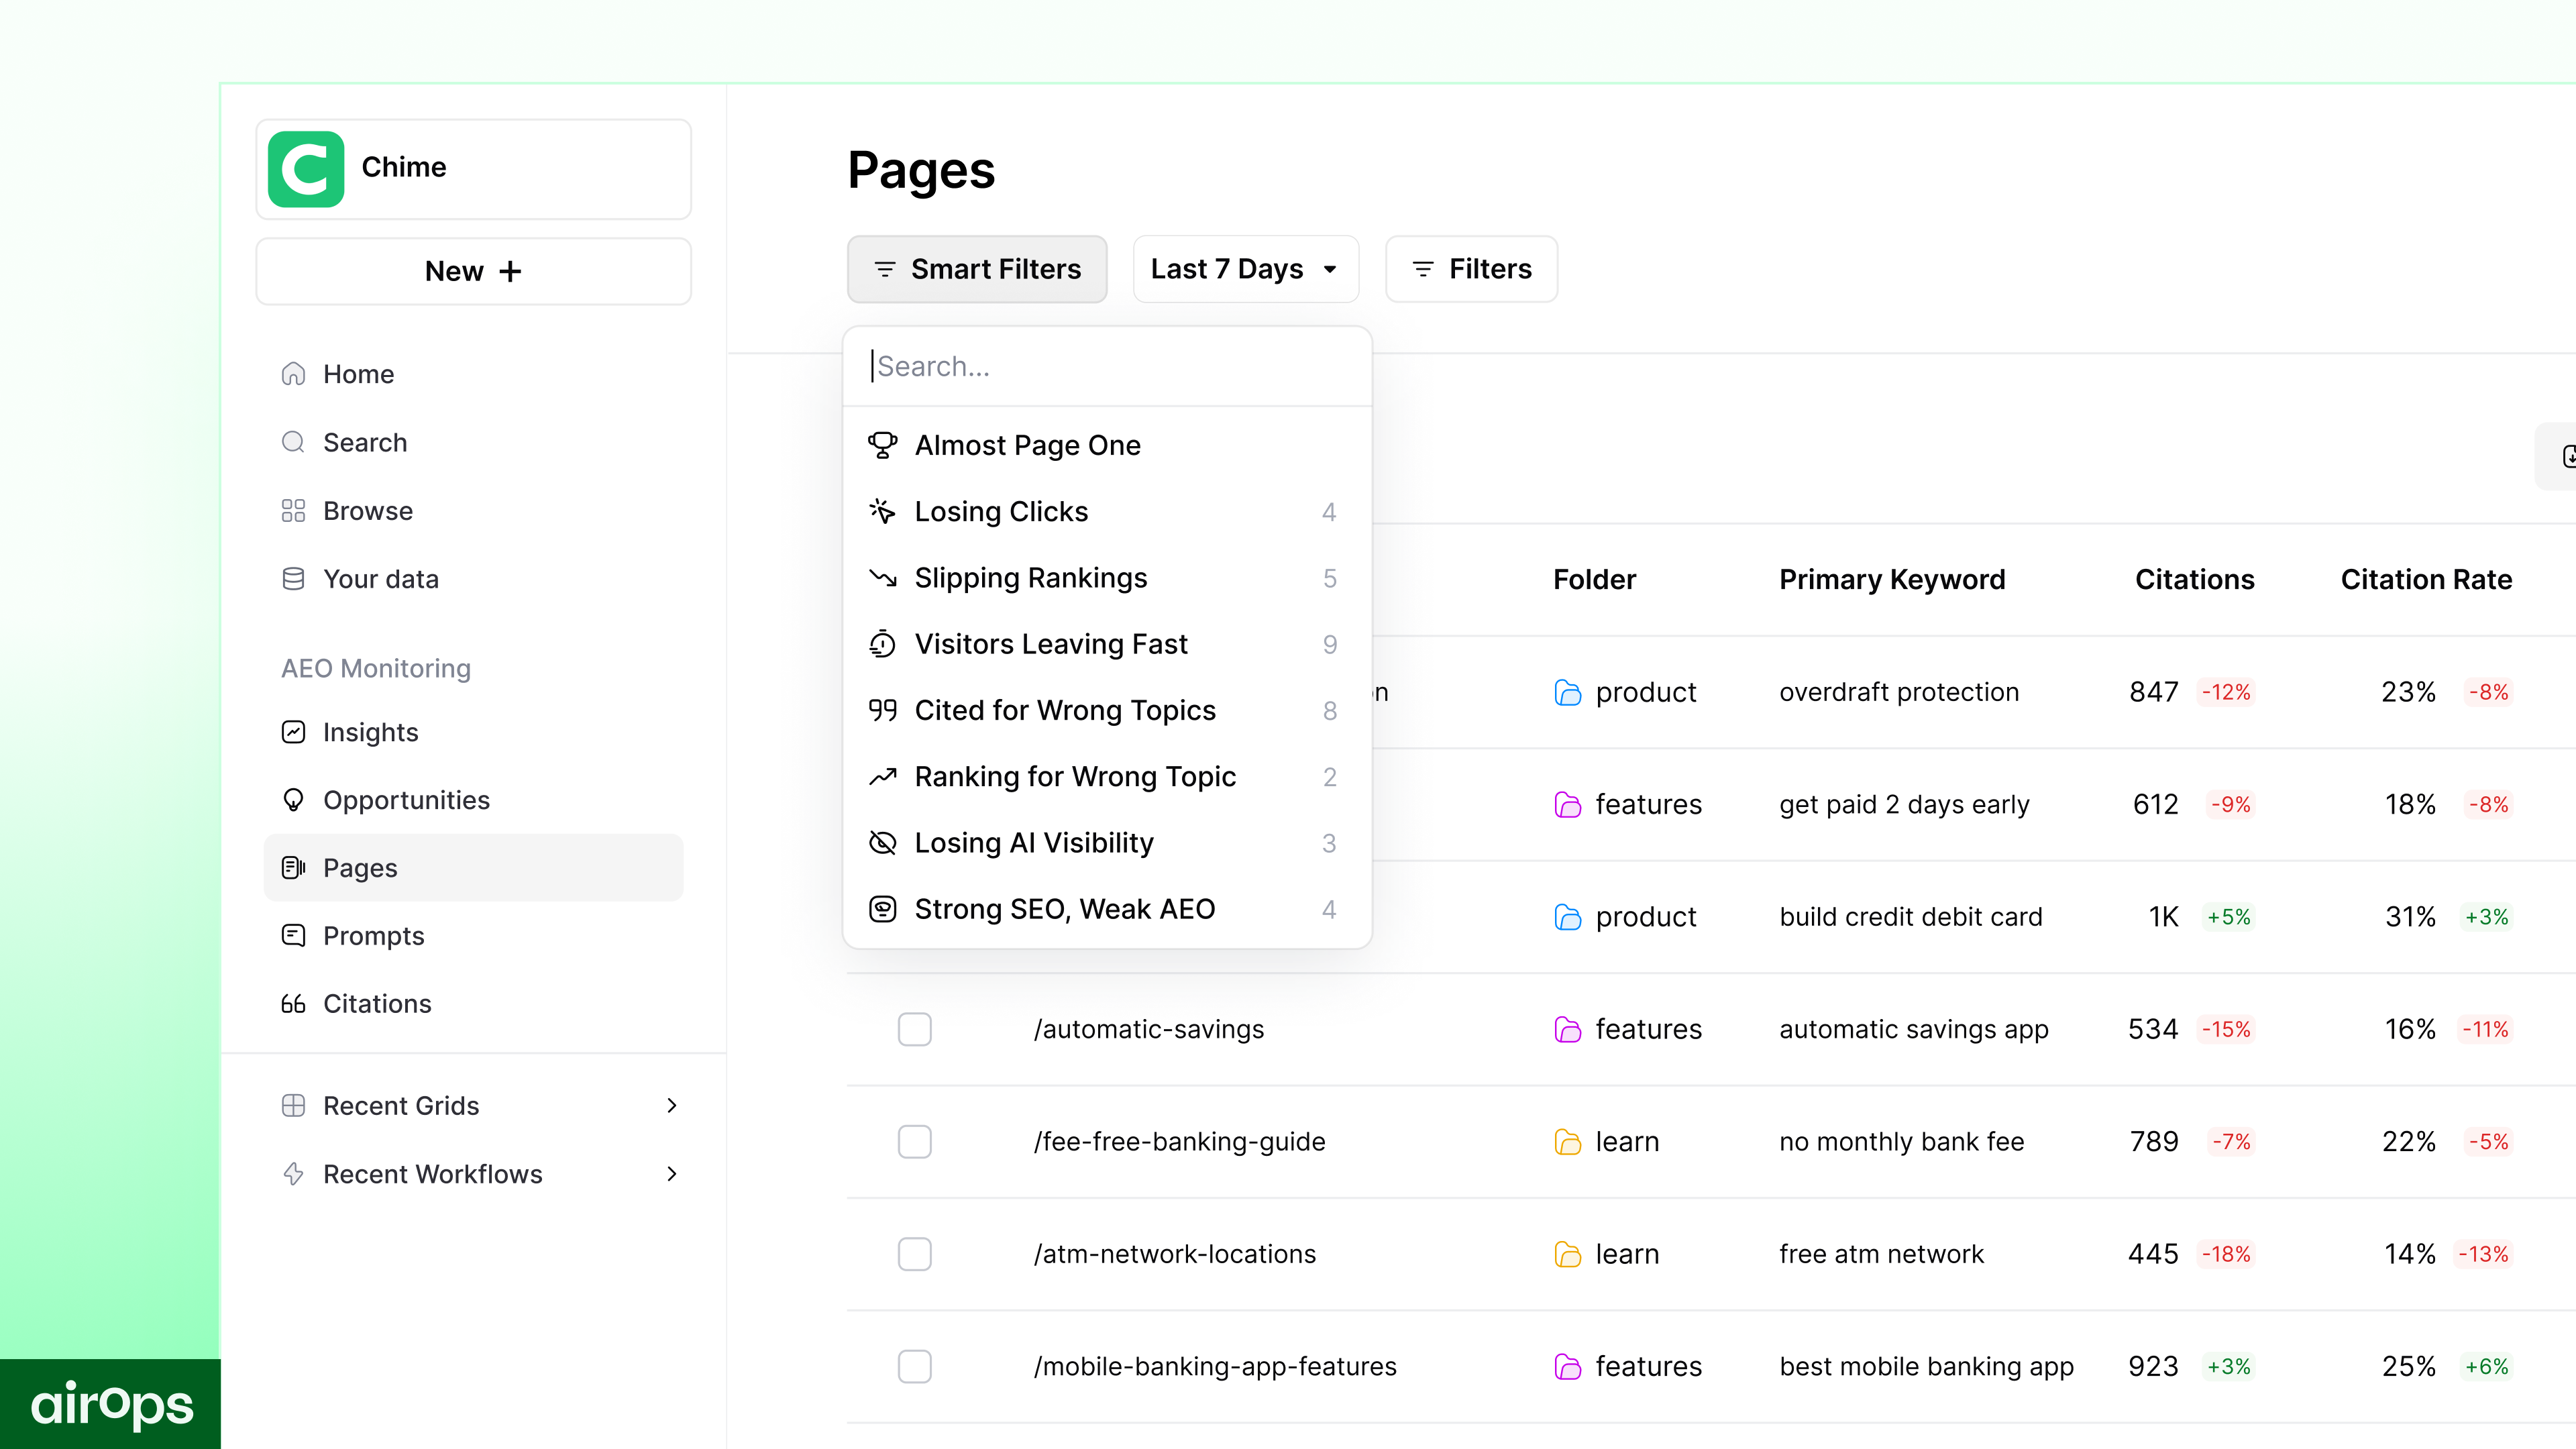
The URL is your join key across every panel. Chart AI share of voice by prompt, then roll it up to the URL it cites. To measure share of voice against named competitors, use our competitive AI share of voice prompts. The Page360 view below shows that join for a single page.
Prompt 4 sets your baseline and finds gaps in your data before the first report.
You are an SEO analyst setting a baseline for joint reporting. Inputs: [paste 90 days of GSC data], [paste 90 days of GA4 AI referral data], and [paste AI visibility export]. Calculate the current value for each dashboard metric. List every data gap, such as untagged AI referrers or pages with no tracked prompts. Return a table with columns Metric, Current value, Date range, Source. Then add a numbered fix list.- Lock the baseline date range before you edit any page.
- Add AI platforms to a custom GA4 channel group first.
- Keep branded prompts in a separate panel from category prompts.
The baseline only holds up with a stable tracker setup. For that setup, see our guide on measuring AI search visibility. To set targets tied to business results, read our guide to outcome-based AEO measurement.
Prompts for joint reporting and metric governance
A monthly narrative and a shared definitions doc keep your joint metrics trustworthy. Prompt 5 writes the joint performance narrative for your SEO peers and channel owners.
You are an SEO lead writing the monthly joint performance narrative. Inputs: [paste this month's dashboard export], [paste last month's dashboard export], and [list the pages you changed]. Summarize what moved in SEO and AEO metrics. Tie each change to a page or prompt. Keep the summary under 300 words. Return two parts: a bullet list of changes, then a short list of next actions.- Send the narrative to channel owners in the first week of the month.
- Lead with the change that needs a decision from them.
- Link each claim to its dashboard panel.
This narrative stays at the working level for your SEO and content leads. For a leadership version with ROI, use the content ROI report prompt as your follow-on. To tie AI visibility to revenue, add our AI pipeline attribution prompt.
Prompt 6 drafts the metric governance doc. Every percentage in your dashboard needs a stated denominator.
You are an analytics lead drafting a metric governance doc. Inputs: [paste current metric list], [paste dashboard spec], and [describe how your AI tracker samples answers]. Define each metric in one sentence. State its denominator, such as per prompt or per response. Separate prompts that name the brand from category prompts. Return a table with columns Metric, Definition, Denominator. Then add a dated change log template.| Metric | Definition | Denominator |
|---|---|---|
| Citation rate | Share of answers that cite your URL | Tracked responses |
| Mention rate | Share of answers that name your brand | Tracked responses |
| AI share of voice | Your brand mentions as a share of all brand mentions | Brand mentions in tracked responses |
| AI Overview impressions | Impressions for AI Overviews and AI Mode | None, a raw count |
| Organic CTR | Clicks divided by impressions | GSC impressions |
Freshness belongs in governance too. AirOps research on stale content found that more than 70% of cited pages had an update within 12 months. Add a last-updated date to your definitions doc.
- Store the definitions doc next to the dashboard.
- Log every definition change with a date.
- Report brand prompts and category prompts on separate lines.
Key takeaways
- Pair every SEO metric with an AEO counterpart on the same URLs.
- Pull AI Overview impressions from GSC and citation rate from your tracker.
- Build one URL-level dashboard with a named owner per panel.
- Set a baseline before you change pages.
- Write a monthly narrative and keep every denominator in one shared doc.
Frequently asked questions
Should I add AEO tracking to my existing SEO dashboard?
Yes. Add AEO metrics as separate panels on the same URL rows, with their own definitions. Shared rows show where one page earns clicks and citations together.
Does Google Search Console show AI Overview data?
Yes. The generative AI performance report shows AI Overview and AI Mode impressions by page, country, date, and device.
Do AEO metrics replace SEO metrics?
No. Rankings and citations measure different steps of the same search journey, so you report both in one view.
How do I track AI referral traffic in GA4?
Create a custom channel group that matches AI platform referrers, such as chatgpt.com and perplexity.ai. Then report those sessions as their own channel.
How often should I report joint metrics?
Review citation rate and mention rate weekly. Report the full joint view monthly with Prompt 5.
What KPIs should I track for AI search?
Track citation rate, mention rate, share of voice against named competitors, AI referral sessions, and pipeline from AI-referred visits. Report each one on a fixed prompt set, by engine, with a stated denominator.
Which AI visibility metrics should I act on first?
Start with prompts where your pages hold AI impressions and earn zero citations. Those pages already rank for the query, so a refresh has the clearest path to a citation. Next, work on prompts where answers mention your brand and cite third-party pages.
AirOps for joint AEO and SEO measurement
AirOps is an enterprise AEO platform and expert partner for marketing leaders, connecting AI search intelligence, coordinated action across channels, and measurement tied to growth.
The dashboard spec and governance prompts define what you track and how you count it. AirOps Analytics fills that spec with live data. Your monthly narrative then starts from the same numbers your dashboard shows.
Page360 joins AI citations and mentions with GSC and GA4 data for each URL. You see which pages earn citations without clicks, and which earn clicks without citations. The Analytics API sends the same joined metrics to your BI tool, so your analyst skips the monthly merge.