The Quiet Death of Pageviews: New Content & SEO Metrics for a Post-Click World


Pageviews, word count, and publish cadence are relics of an era when human clicks defined SEO success.
With Google AI Overviews, zero-click content, and LLM-powered answers, being at the top of the SERPs no longer guarantees traffic. But that doesn’t mean your SEO and content isn’t working.
This is an era of "no-click marketing," where the true value of content is measured by influence, authority, and how well AI systems trust and cite your work. This shift demands new core metrics.
A recent survey from Bain says that 80% of searches rely on “zero-click” results in at least 40% of their searches, reducing organic web traffic by an estimated 15% to 25%.
Traditional content metrics like page views and content “depth” are not as valuable in evaluating the effectiveness of AI-powered content production.
AI tools have led to a fundamental shift in how we approach content strategy. Rightfully, most marketers use AI as a key part of their routine.
The AirOps State of Content Teams report (coming soon!) shows that 38% of teams have partial implementation of AI in their content workflows.
Brian Balfour of Reforge notes:
“Every decade or so, a technological shift comes along that doesn't just change how we build products—it rewrites the entire playbook... The shift to AI will completely redefine product teams.”
This applies to yes, product, development, design, but with content and marketing too.
In this post, we’ll examine the different ways and reasons for 5 new core SEO metrics that you’ll want to track as an AI-first content team.
Part 1: Why you need new content & SEO metrics
Traditional content metrics like page views, word count, and publish cadence weren’t built for an AI-first world. In 2025, they only tell part of the story.
Even if Google is still dominant, their AI Overviews have changed how people are clicking and taking in info. The SERP list of relevant articles is barely existent, or at least far down the page.
Here’s March 2025 research from Ahrefs:
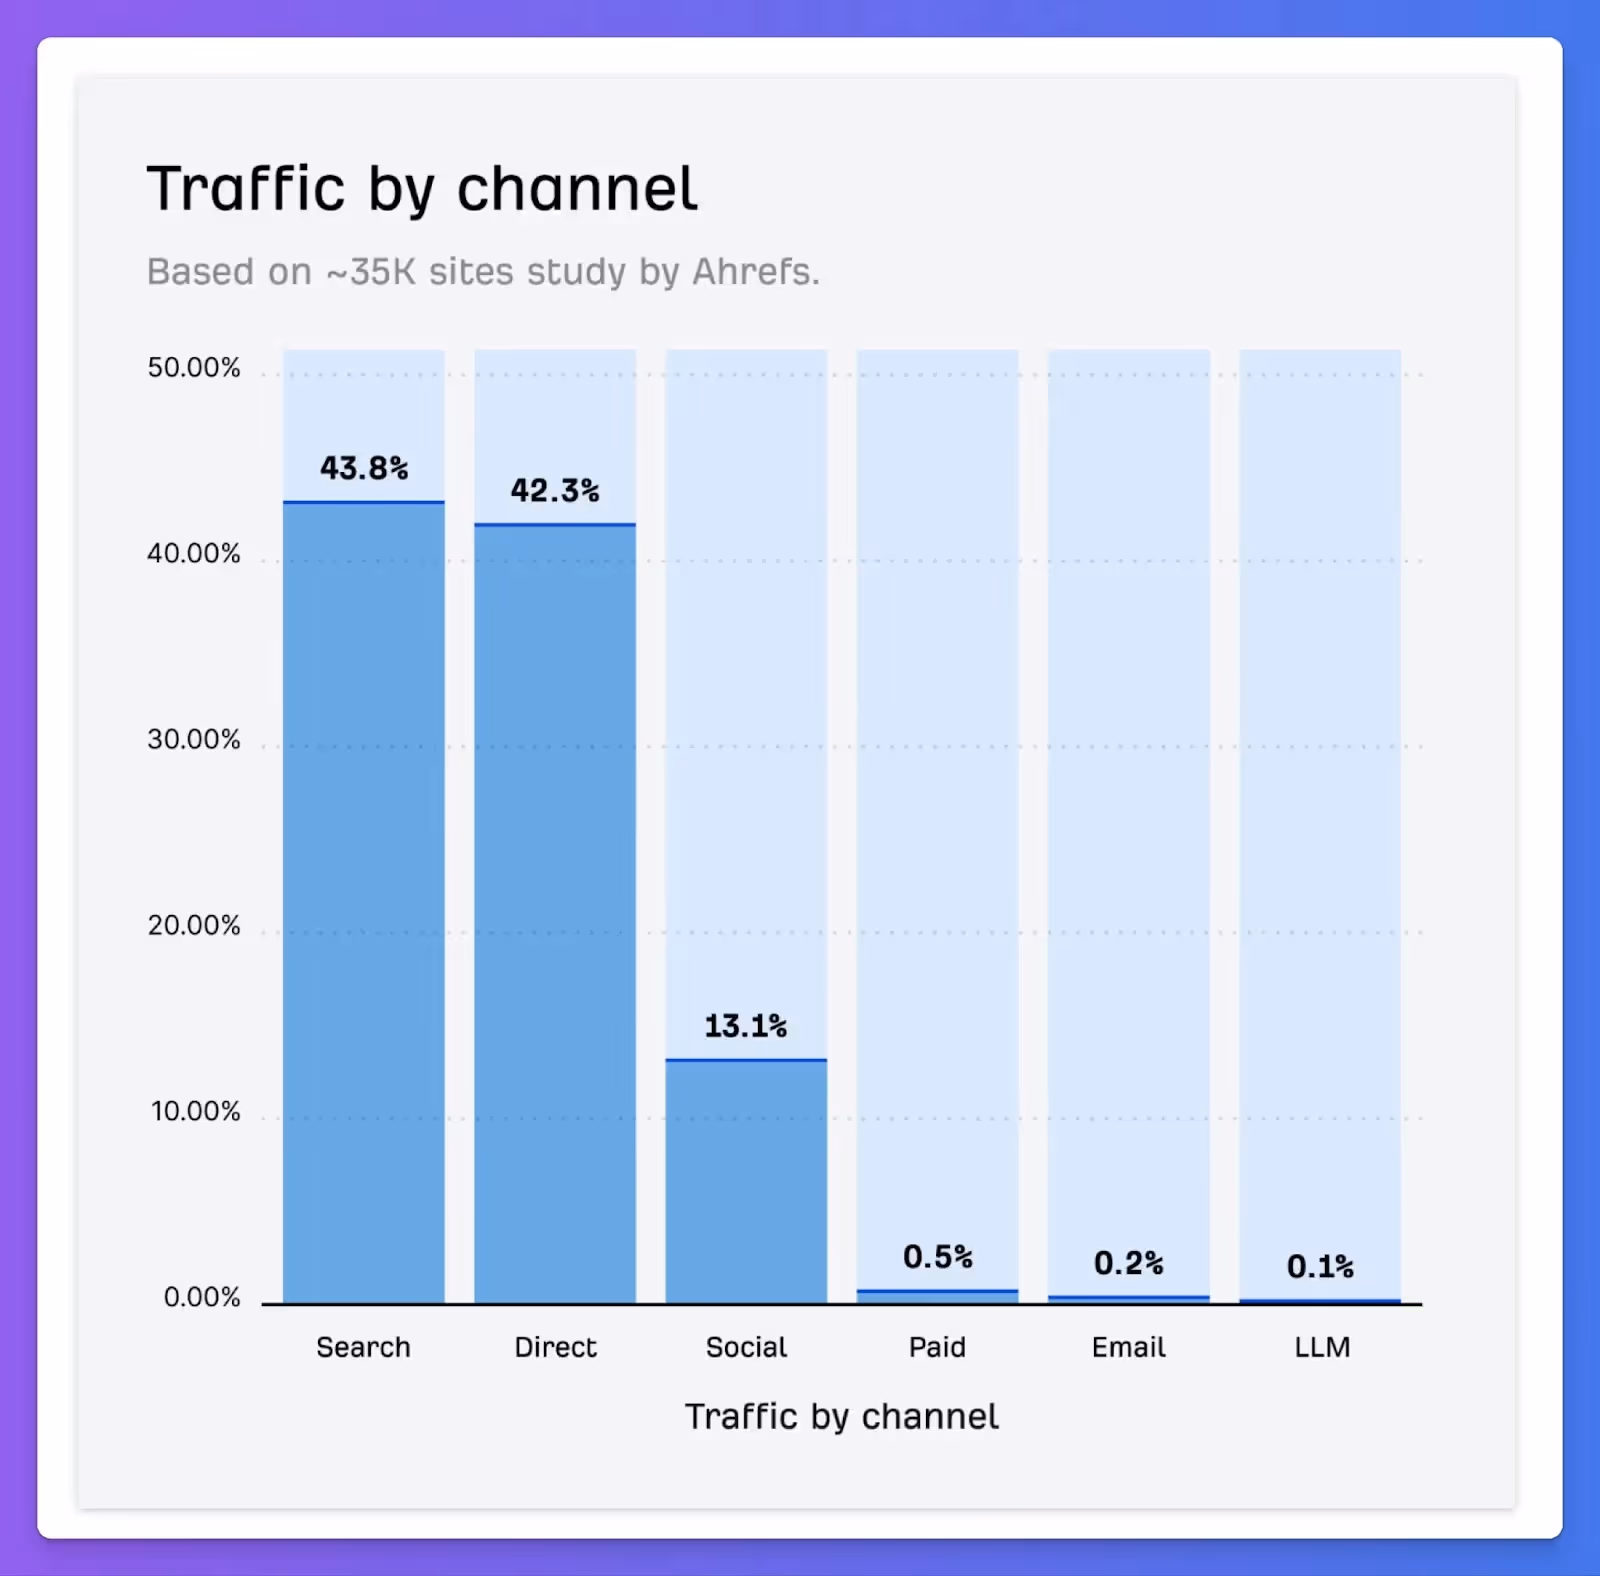
Changes to consumer behavior and marketing platforms like Google’s AI Overviews and LLM SEO change the measurement of brand awareness and marketing as a whole.
Zero-click content: The page view paradox
Page views no longer reflect actual content consumption.
AI platforms like ChatGPT and Google's featured snippets deliver answers without users ever clicking through to your site.
Amanda Natividad, Head of Marketing at SparkToro coined the term Zero-Click Content to explain content that does not drive organic traffic, but addresses specific search queries.
“Zero-Click content is content that offers valuable, standalone insights (or simply engaging material), with no need to click. Clicking might be additive, but it’s not required.”
As AirOps CEO Alex Halliday notes, Answer Engine Optimization is the new North Star and is now the key to visibility in AI-powered search environments.
It focuses on making content authoritative, well-structured, and easily citable by AI systems, positioning it to be the go-to source for AI-generated responses. Brands that excel in AEO will see their content featured directly in AI answers, even if users never visit their website.
As Halliday elaborates, the true value of content today is based on how it is perceived and trusted by AI agents, not just human readers. Content that is unique, authoritative, and persuasive to AI systems is more likely to be cited, resulting in greater visibility in this new landscape.
AEO requires content to be deeply researched, provide unique insights, and be formatted in a way that is easily parsed by AI.
This shift means content creation teams need to move beyond traditional SEO tactics, focusing on authority-building and structuring content to serve as a reliable source for AI responses.
As AI continues to reshape search, understanding and implementing AEO will be essential for brands to maintain their relevance in an increasingly automated world.
Is word count a trap?
Word count has become an irrelevant productivity metric. While traditional content creation often focused on sheer volume, AI tools can instantly generate thousands of words in minutes, far surpassing the output of a skilled human writer.
A CoSchedule survey says that 85% of marketers use AI for writing or content creation tools now. However, this flood of content thata teams now have access to doesn't necessarily equate to higher quality or engagement.
This is now known as AI Slop. The “anti-AI-slop” is when quality outweighs quantity.
The focus has shifted from cranking out large amounts of content to delivering well-researched, relevant, and meaningful material that can be hastened by AI content workflows. (Check out this post on quality vs. quantity for more).
AI-generated content, while fast, still requires human oversight to ensure it adds true value, aligns with brand voice, and meets user intent.
This shift in focus encourages content teams to prioritize depth, authority, and engagement rather than being fixated on word count or sheer output.
Quality content is what will continue to drive user interaction, enhance SEO, and build trust with both audiences and AI systems—especially for high-performing SEO teams.
Speed is table stakes: The new time-to-value metric
Production speed alone provides no competitive advantage when everyone has AI tools. Three rapid but mediocre articles will underperform one strategically targeted piece every time.
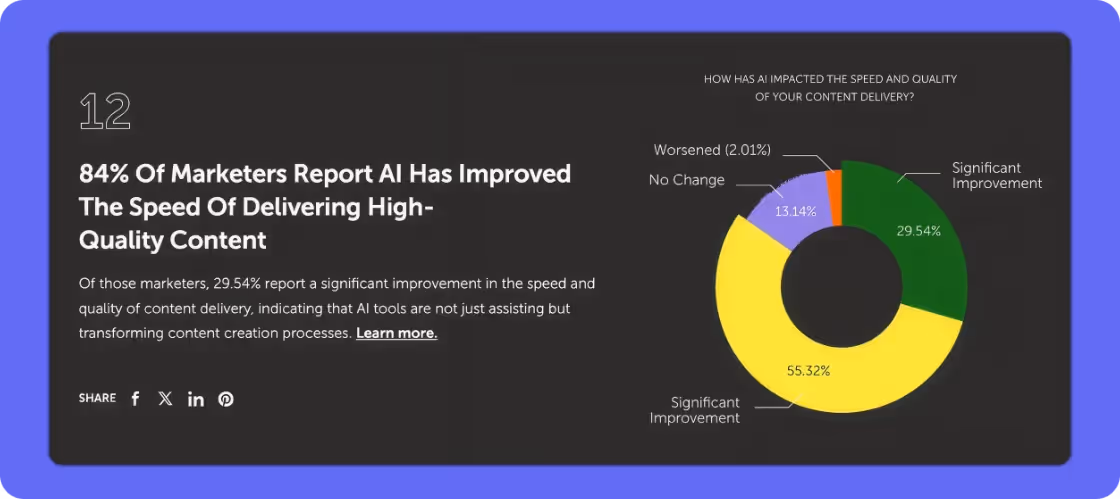
As CoSchedule showed, AI has improved the speed of high quality content delivery across the board:
What actually moves numbers: Business impact metrics
AI-first teams need metrics that directly connect to business outcomes. Ultimately this means that measurement comes down to how content influences purchase decisions, reduces support costs, or establishes authority in AI systems.
Part 2: So…what are the new SEO metrics then?
Traditional SEO and content metrics fail to capture the unique dynamics of AI-powered content creation.
AI-first teams need a modern measurement framework—one that blends quality, velocity, consistency, and AI integration into a unified view of performance.
Investor and product expert Scott Belsky describes velocity in terms of cycles, which ultimately leads to greater creativity:
“What this technology really gives us is MORE CYCLES - more cycles to explore a wider array of color palettes, more cycles to explore those ten or ten thousand other pathways for drug discovery or marketing slogans than humans can possibly pursue…I have become obsessed with contemplating the problems in every industry and our everyday life that could be transformed with more cycles. Truth is, no matter your role or industry, we are all in search of cycles. The key question is: Cycles for what, and what becomes exponentially better as a result?”
These core metrics serve as early indicators of output quality and operational efficiency, helping teams course-correct before performance dips or misalignment compounds.
New content metric #1: Quality of output
AI has driven the marginal cost of content creation to near zero—but that doesn’t mean the real cost is zero.
Measuring the true cost per output means factoring in automation efficiency, human oversight, and the value of the end result.
You can now generate content for fractions of a penny per word.

But cheap content isn't always usable content.
As noted in McKinsey’s State of AI survey:
“The redesign of workflows has the biggest effect on an organization’s ability to see EBIT impact from its use of gen AI.”
Focusing on the output, and the quality of that output, is an important measure of cost of output.
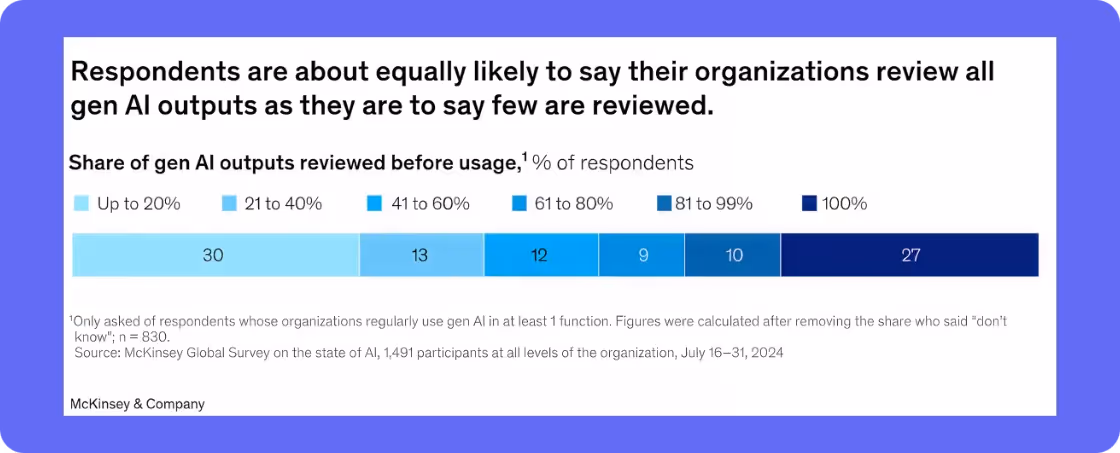
This shows that human review is a huge part of any AI content workflow and it’s a big part of the AirOps process.
To close the loop, AI-first teams should track:
- Cost per usable asset, not just cost per word. How good is the output from your AI creation?
- Resource allocation efficiency (output per team member per week)
- ROI benchmarks by content type or campaign
This metric forces teams to weigh automation savings against quality assurance investments and identify which blend delivers the most value.
With the time saved on research or even refresh workflows, there's more to invest in video, graphics, design, and other media types to help your content stand out.
New content metric #2: Response quality from AI tools
Quantity without quality is just noise. As content production scales, AI-first teams must ensure that outputs meet high standards for accuracy, completeness, and contextual relevance.
Use structured evaluation frameworks, such as internal rubrics or third-party evaluators, to score AI content across:
- Groundedness and relevance (e.g., RAG scores)
- Technical clarity and coherence
- Factual accuracy and consistency with brand voice
Layer in user feedback and satisfaction scores to understand how real audiences perceive the content. Over time, track which types of outputs require the most human intervention and where AI performs reliably.
This helps you pinpoint when and where to reinvest human effort and where you can scale with confidence.
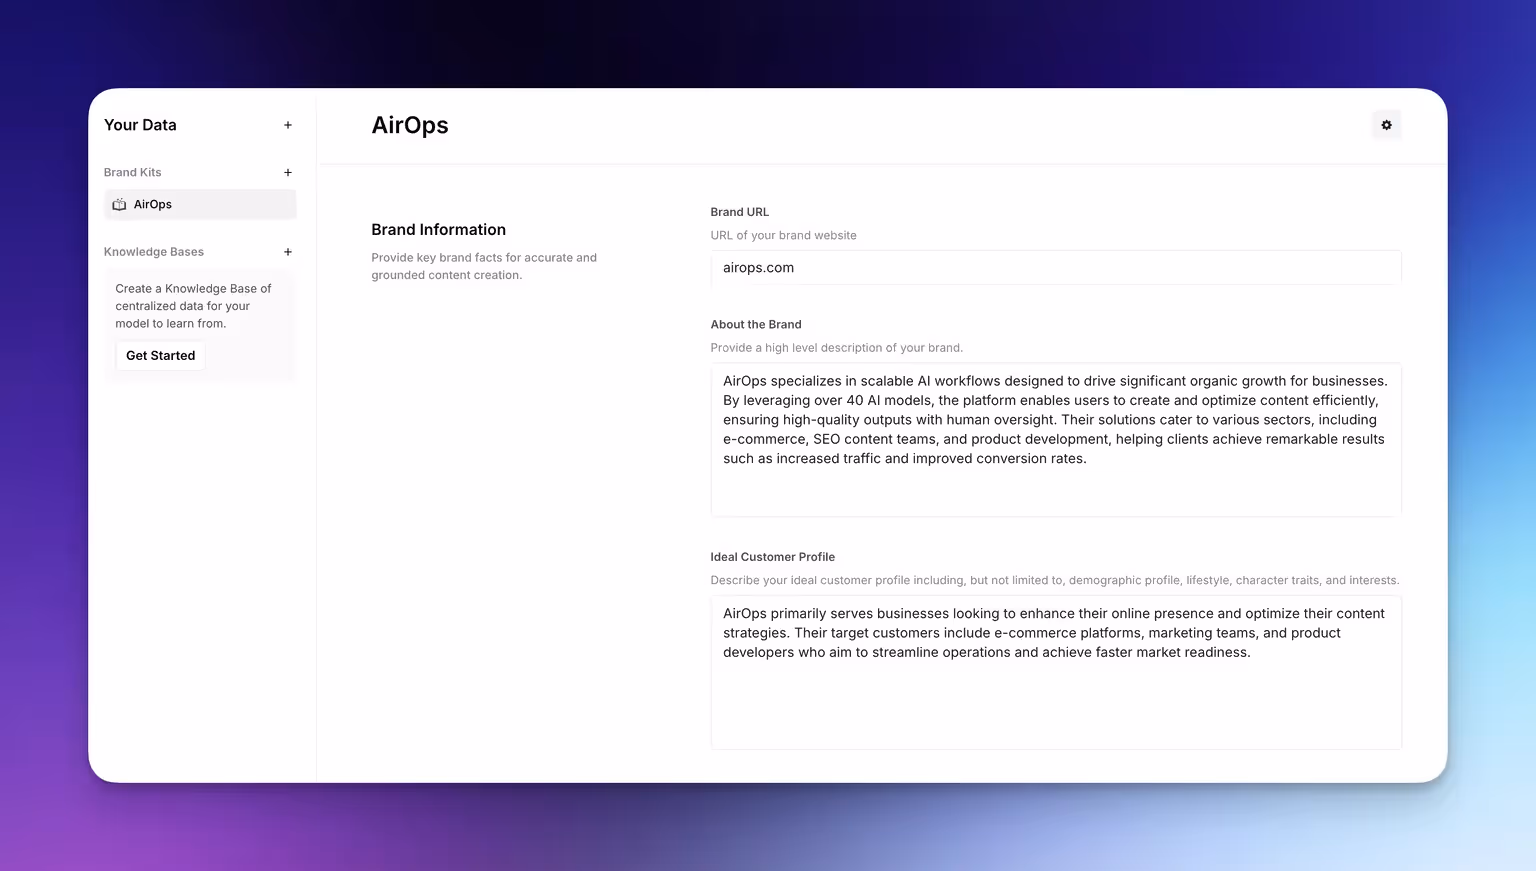
How do you ground the outputs with your brand voice?
With AirOps brand kits and knowledge bases, you can add your own data, documents, transcripts, reports or whatever previous content you’ve developed to help ground your outputs in your own brand.
This gives you something unique that fits your company.
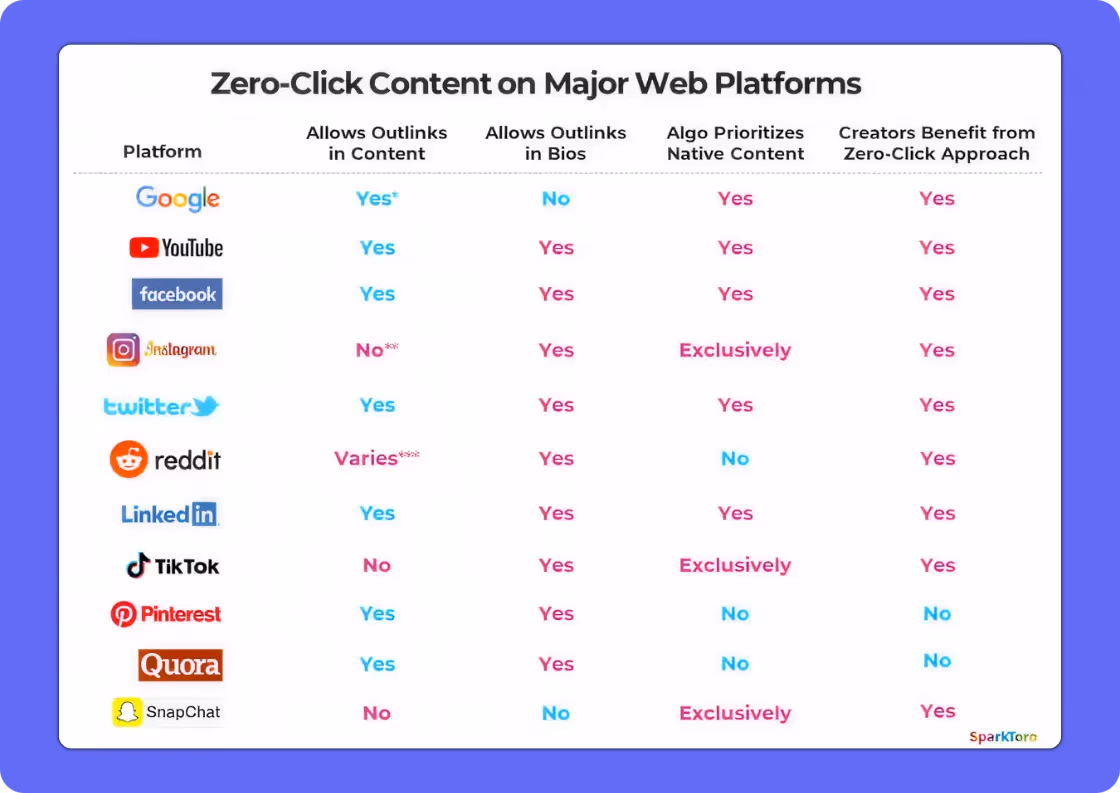
New content metric #3: Branded impressions
Brand visibility today stretches across search engines, social platforms, Large Language Models (see AI-First SEO), and community-driven ecosystems (referring to Reddit and SEO). All this falls under “Brand Impressions” now.
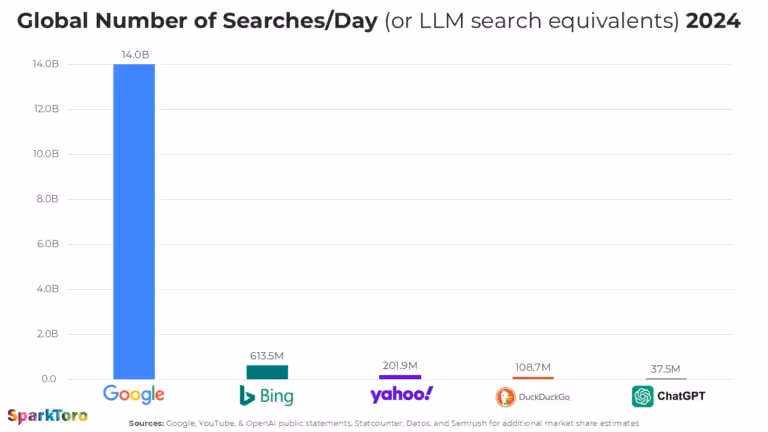
Though there is a lot of attention and effort given to optimizing for LLM searches, Google received ~373x more searches than ChatGPT in 2024, per SparkToro
Brand visibility (and impressions) are still happening in huge numbers. Google dominates attention, so optimizing for visibility on platforms like Google is still where most brand impressions occur.
Thus, AI-first content teams now need to track multiple metrics to capture full brand impressions:
- Branded search volume and trendlines (Google Search Console and Google Trends are good for this)
- Brand impressions across social networks, newsletters, and third-party blogs (SparkToro is good for this)
- Brand mentions in LLMs and AI tools (e.g. ChatGPT, Gemini, Perplexity)
- Sentiment and context of mentions—is your brand seen as a trusted source?
Tools like Ahrefs Brand Radar are good to address the last two metrics, to help you benchmark your brand performance and AI search visibility against competitors and identify shifting trends over time.
Ultimately, brand impressions only matter if they’re happening where your audience actually spends time.
New content metric #4: Referral traffic
As AI Overviews become more common, it’s also important to monitor how they affect referral traffic.
A study from Seer Interactive found that organic CTR drops by as much as 70% when AI answers are shown, and this makes it even more critical to earn featured snippets and brand mentions early in the search journey.
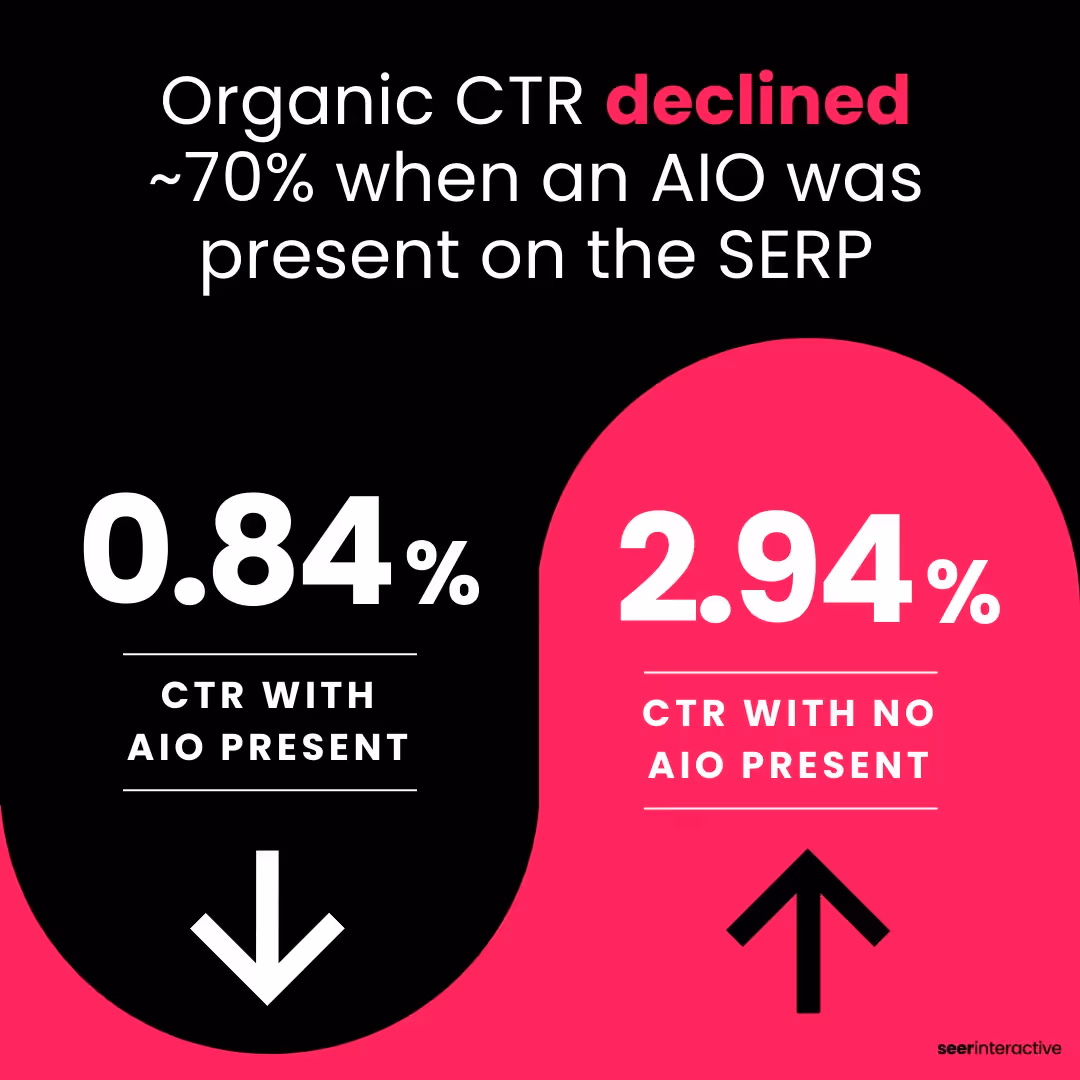
(A silver lining though is that being cited as the AIO source increases CTR, vs when not cited as an AIO source).
As traditional search CTRs drop, referral traffic from LLMs is becoming one of the most important emerging metrics for SEO and content teams.
Track which LLMs are surfacing your content and how often they link back to your domain.
Tools like Ahrefs are starting to show visibility in these overviews, and platforms like Perplexity are already passing referral traffic.
This metric ties directly to:
- Your visibility in AI-generated answers
- The structure and schema of your content
- Your ability to embed citation-worthy hooks (stats, frameworks, clear value props)
Referral traffic from AI platforms is the new SEO gold—especially as Google continues to replace organic listings with AI summaries.
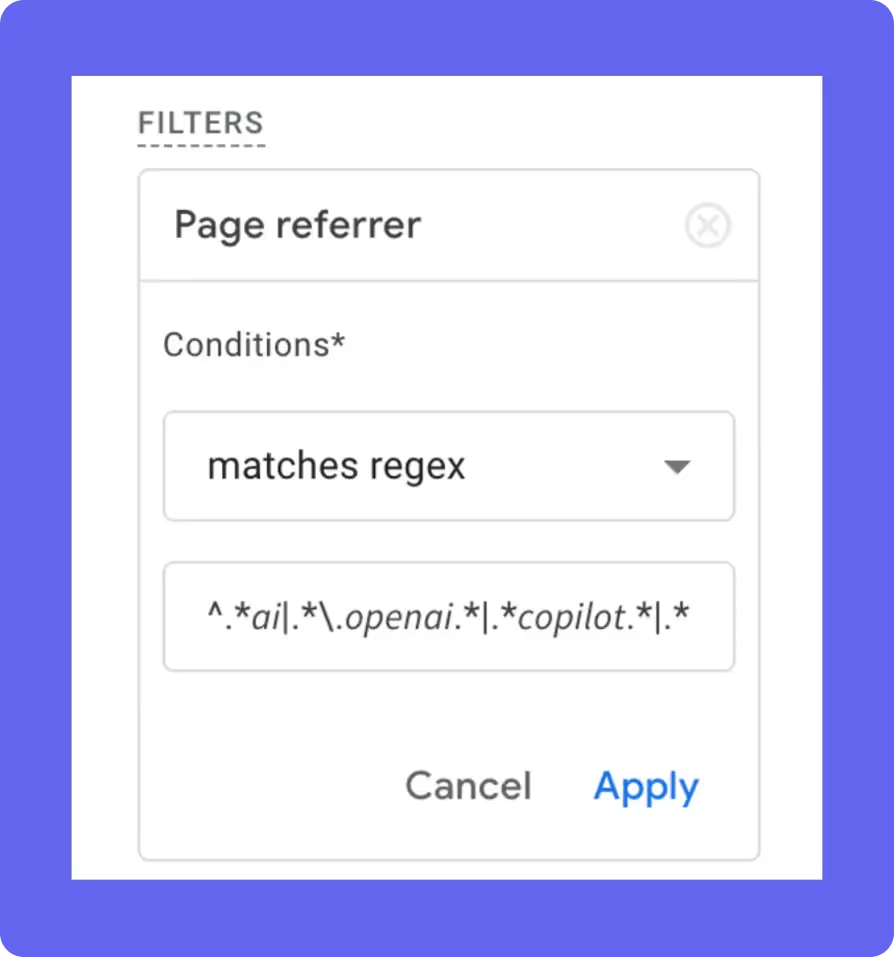
Setting up your Google Analytics to track LLM referral traffic takes a few custom steps (explained here), but this will be critical as Google continues to replace organic listings with AI summaries.
New content metric #5: Impressions in AI overviews
Think of this as the new SERP visibility metric.
AI Overviews and answer boxes increasingly dominate above-the-fold real estate, reducing click opportunities but amplifying exposure.
So while traffic may go down, impressions and prominence in these overviews matter more than ever.
To measure this:
- Track how often your site or content is cited in AI Overviews
- Analyze context and prominence of citations (headline, footnote, buried mention?)
- Benchmark positioning against competitors for key queries
This metric reframes success, where becoming the authoritative source that AI chooses to quote is more important than simply ranking #1 in the SERP.
AI integration effectiveness
Prompt engineering ROI: The efficiency multiplier
Prompt effectiveness directly correlates with AI output quality and team productivity. Sophisticated teams track metrics like first-attempt success rate, instruction efficiency (words in vs. usable output), and revision cycles. But as AI becomes more embedded into workflows, a deeper layer of evaluation is needed.
The Azure AI Foundry offers a glimpse into how advanced teams are automating evaluation. Their framework assesses AI outputs on multiple fronts: Quality (like groundedness, fluency, and similarity), Risk & Safety (flagging hate, self-harm, or jailbreaks), and Custom Evaluators tailored to specific use cases.
As Azure notes:
“Groundedness refers to how well an answer is anchored in the provided context, evaluating its relevance, accuracy, and completeness based exclusively on that context.”
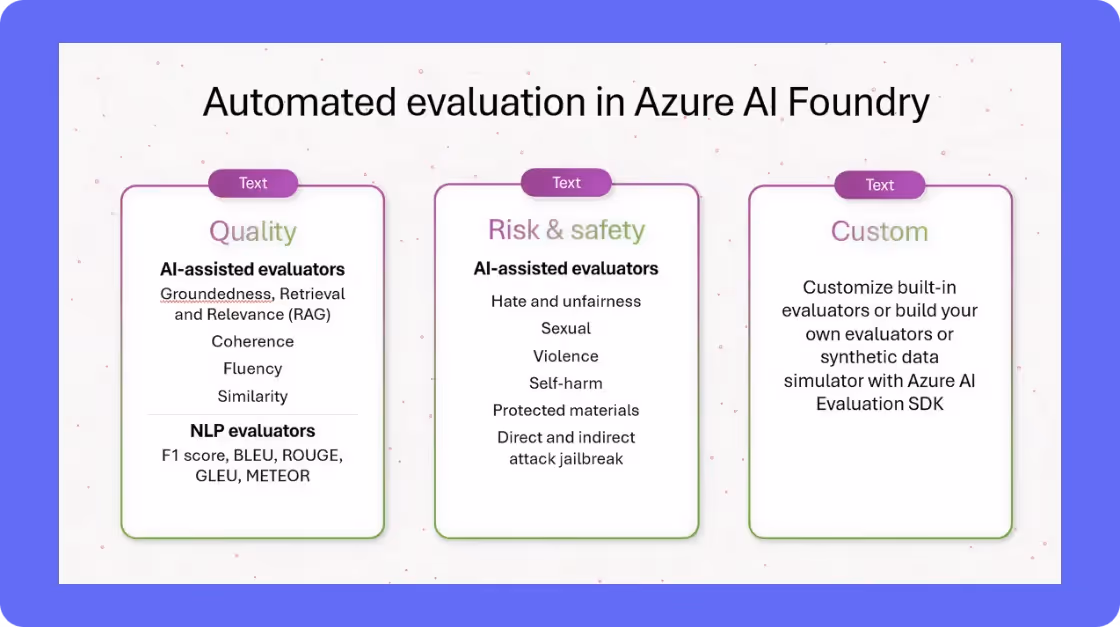
This type of layered evaluation is critical for AI-first teams.
It helps create reliable, safe, and brand-aligned outputs at scale. Teams should adopt or build similar frameworks to assess not just output volume, but output integrity.
AI-assisted vs. Manual time
Time is your most valuable resource. Break down content workflows by category—ideation, research, writing, editing—and measure time spent by humans vs. AI. This gives visibility into where AI delivers the greatest lift and where human creativity still dominates.
This helps to optimize the human-AI division of labor based on value, not volume.
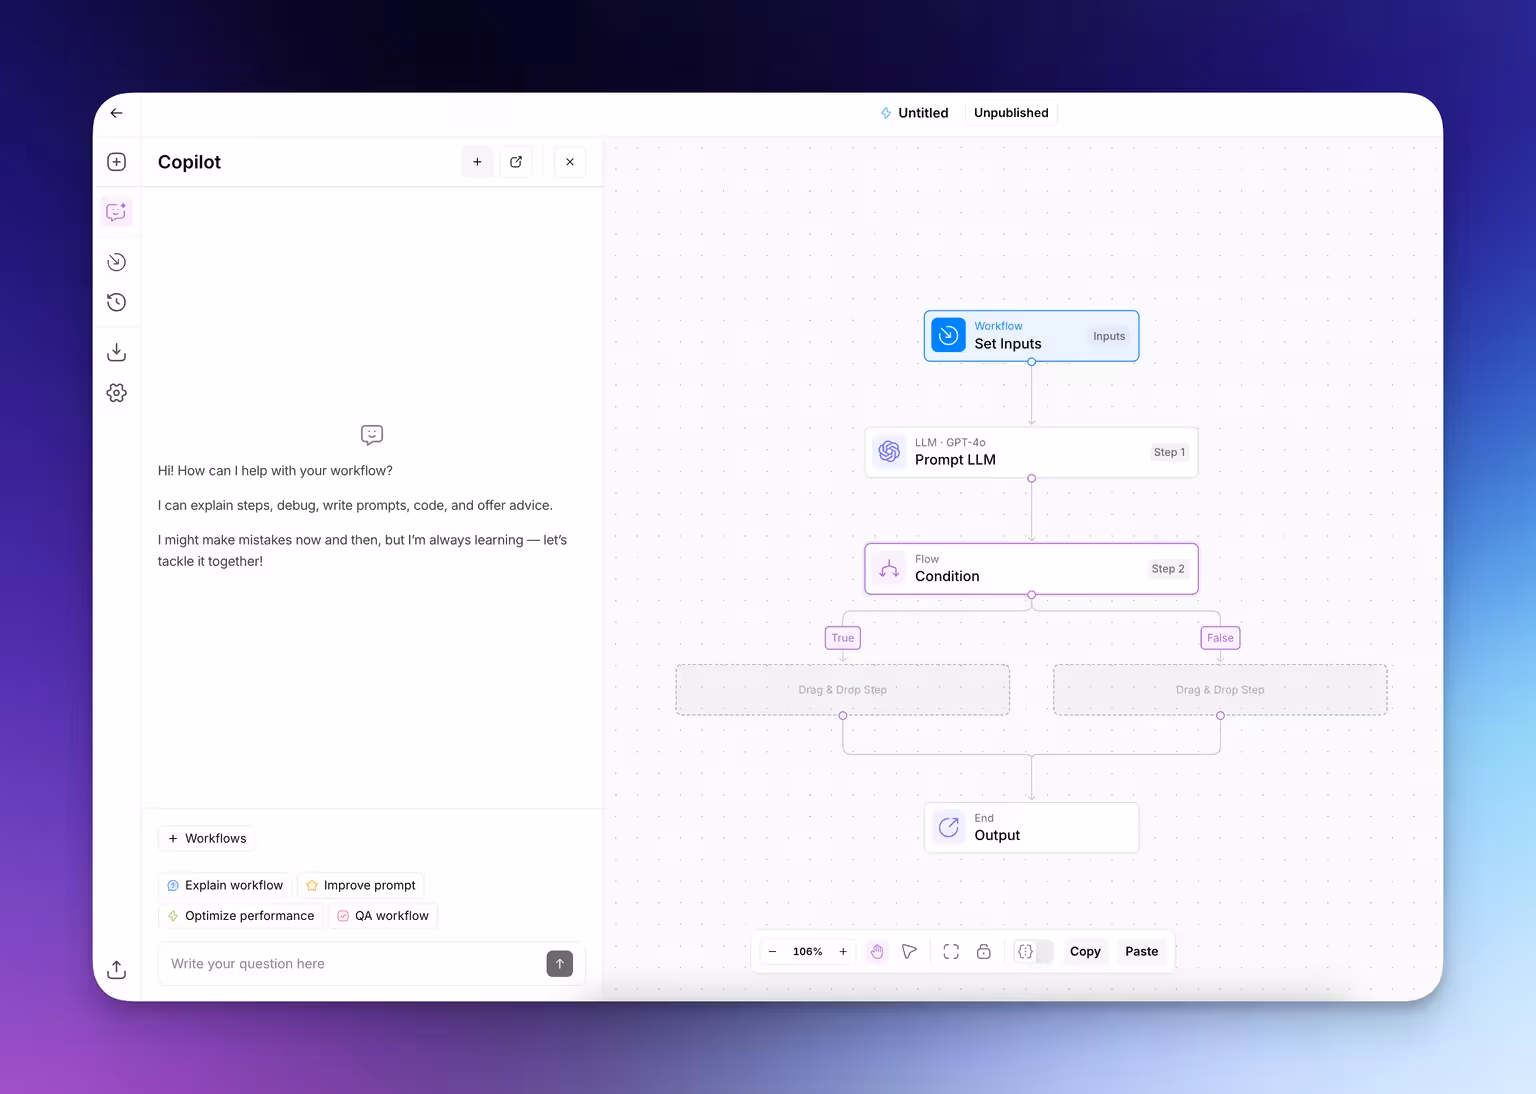
For instance, in AirOps you can use Copilot to help you build workflows. You don’t have to be an expert coder to get started building workflows. The Copilot walks you through step-by-step.
This shift underscores the need to track speed, and how intelligently and collaboratively content is produced. High-performing teams monitor where AI accelerates output, where human input sharpens quality, and how both combine to create standout results.
Error reduction rates
One of AI’s most practical advantages is precision at scale when it is set up correctly.
Track error rates by category (e.g., factual accuracy, tone deviations, brand guideline violations) before and after AI implementation.
Create a monthly or quarterly error taxonomy to identify recurring issues and evolve your QA protocols accordingly. Over time, you’ll surface which workflows can be trusted with AI and which still need human review.
Here are AI prompts to help you get content that is ideal for helping you achieve unique content.
Automation success rates
How much of your workflow can AI truly own?
Measure the percentage of tasks or stages that are fully automated, partially AI-assisted, or human-only.
Track the consistency of results in each category to ensure automation doesn’t degrade quality. Use this to build a workflow automation map, guiding future investments and process redesign.
Optimizing the human-AI divide: Time allocation metrics
Measure where human time creates maximum value in your AI workflow.
Top teams track time spent across ideation, writing, tagging, and QA to uncover where AI drives efficiency and where human judgment still wins.
Toys“R”Us cut SKU onboarding time by 90% by automating product tagging, SEO metadata, and PDP copywriting with AirOps.

The results were impressive:
- 30% YoY organic traffic growth
- 45% lift in keyword rankings
- More time for high-impact brand work
As VP of E-Commerce, Gary Haas put it:
“Now we get items online faster and don’t worry about inconsistent product data—the system handles it automatically.”
This is what smart time allocation looks like in an AI-first team.
From inconsistency to precision: Error reduction tracking
AI has the potential to reduce human error—but only if you track where those errors come from and how they change over time.
Start by categorizing errors across your content pipeline:
- Factual inaccuracies (wrong stats, product details, claims)
- Brand inconsistencies (tone, terminology, off-brand language)
- Grammar or formatting issues
- Compliance and legal missteps
Then, measure the frequency and severity of each type before and after introducing AI.
For example, track how many brand guideline violations or factual errors are caught in QA each week. This baseline shows where AI is improving precision—and where it still needs human support.
Over time, your error tracking data becomes a roadmap: it reveals where automation delivers consistency and where human review adds essential value—ultimately making your workflows sharper, faster, and more scalable.
AI integration effectiveness
Teams fall into a spectrum of just playing around to being fully integrated with AI workflows. Here’s more from our upcoming State of Content Teams report.
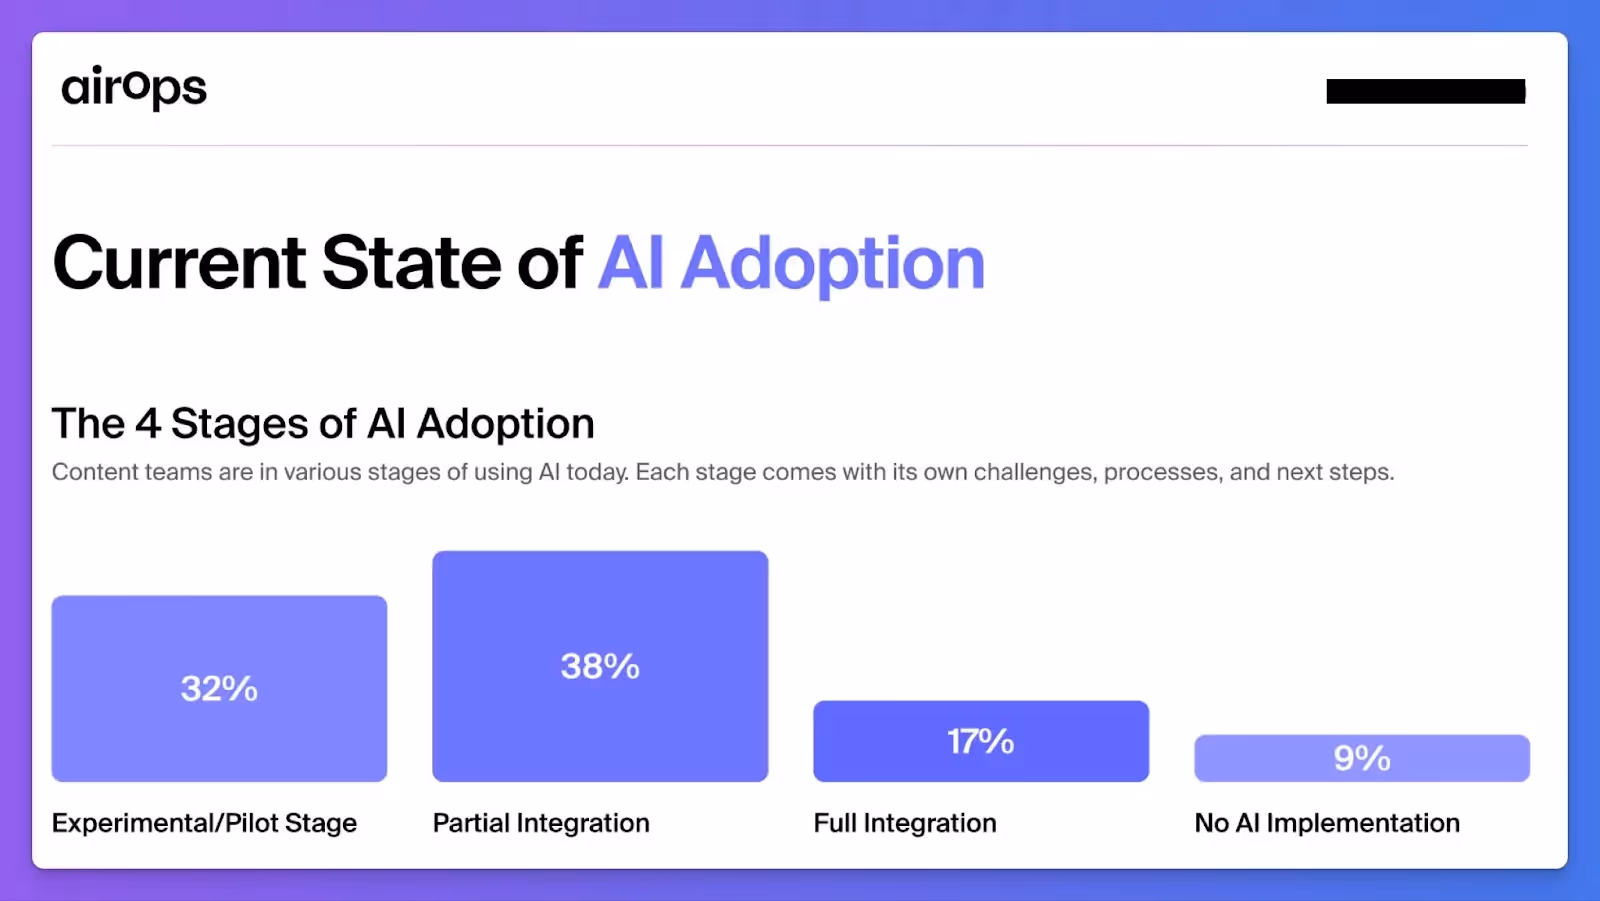
As you can see, teams are in various stages of AI adoption. But how do you know if you’ve successfully implemented your AI processes?
Prompt effectiveness is a new metric that measures how efficiently your team translates intent into AI-generated outputs. Organizations with sophisticated prompt engineering capabilities can extract significantly more value from the same AI tools.
Track the percentage of prompts that generate usable outputs on the first attempt, the average number of refinement cycles needed, and the consistency of results across different team members. Develop a prompt library of proven templates, and measure performance improvements as it grows.
AI-assisted vs. Manual time allocation provides insight into how effectively your workflows blend human and artificial intelligence. The goal is to optimize the division of labor.
Track which tasks are fully automated, which require AI assistance plus human refinement, and which remain primarily human-driven. Measure time spent in each category and correlate with quality outcomes to identify the optimal balance.
Error reduction rates help quantify one of AI's most valuable contributions: consistency and accuracy at scale. Track both the frequency and severity of different error types before and after AI implementation.
Categorize errors by type (factual inaccuracies, grammar issues, brand inconsistencies, etc.) and track improvement over time. Many teams find that certain error categories nearly disappear with AI assistance, while others require ongoing human oversight.
Automation success rates measure how completely different content workflows can be automated with AI. This isn't about replacing humans but about identifying which processes can be streamlined to free up strategic thinking time.
Track the percentage of each workflow that can be reliably automated, the consistency of results across different content types, and the evolution of these ratios as your AI implementation matures.
Part 3: Measuring team performance
AI fundamentally transforms how content teams operate, exposing broken content team structures and requiring new performance metrics that capture collaboration effectiveness.
High-performing teams in 2025 are measured by how effectively they collaborate, adopt new tools, and drive meaningful results with fewer resources. This requires new team-centric performance metrics that capture both operational efficiency and skill development in an AI-first environment.
Productivity metrics
Team capacity utilization
Track how much of your team’s available time is actively being used toward high-impact content activities. Leading teams benchmark capacity using a strategic vs. tactical ratio—typically targeting a 70/30 split, where 70% of time is spent on high-leverage tasks like planning, optimization, or performance review, and 30% on execution.
Workflow efficiency scores
Measure the speed and quality of content moving through your pipeline—from ideation to publication. Analyze cycle time per content type, first-draft approval rates, and the number of revisions required per piece. These metrics expose where time is lost and where AI is truly accelerating output.
Bottleneck reduction
AI removes some bottlenecks but creates others. As content velocity increases, delays often shift to human-dependent steps like compliance, approvals, or editing. Use process mining to identify these friction points and prioritize automation or re-engineering of the slowest links in your chain.
Resource allocation effectiveness
Not every task needs a senior strategist—or a human, for that matter. Measure where your team's time is best spent by tracking time per task category (e.g., generation, editing, QA, ideation) and comparing it to performance outcomes. This helps you reallocate human capital toward the work that AI can’t do—yet.
Skill development
AI tool proficiency
Track each team member’s ability to use your AI tools effectively. Metrics like time-to-output, success rate of first-draft completions, and usage of advanced features (e.g., fine-tuned models or schema integration) reveal skill maturity.
Prompt engineering capability
Prompts are the new creative briefs. Evaluate how well team members translate ideas into effective prompts using a “Template Effectiveness Score”—tracking first-attempt output quality, revision cycles, and overall prompt reuse across content types. Teams that master this see faster output and fewer QA interventions.
Cross-functional collaboration
Measure how quickly insights and techniques spread across roles. This includes prompt libraries, standardized workflows, and shared QA checklists. Use knowledge transfer velocity metrics like “time to adoption” to track how fast new skills or tactics are embraced by the wider team.
Learning curve acceleration
AI tools evolve quickly—so must your team. Track training hours against productivity lift to measure Learning ROI.
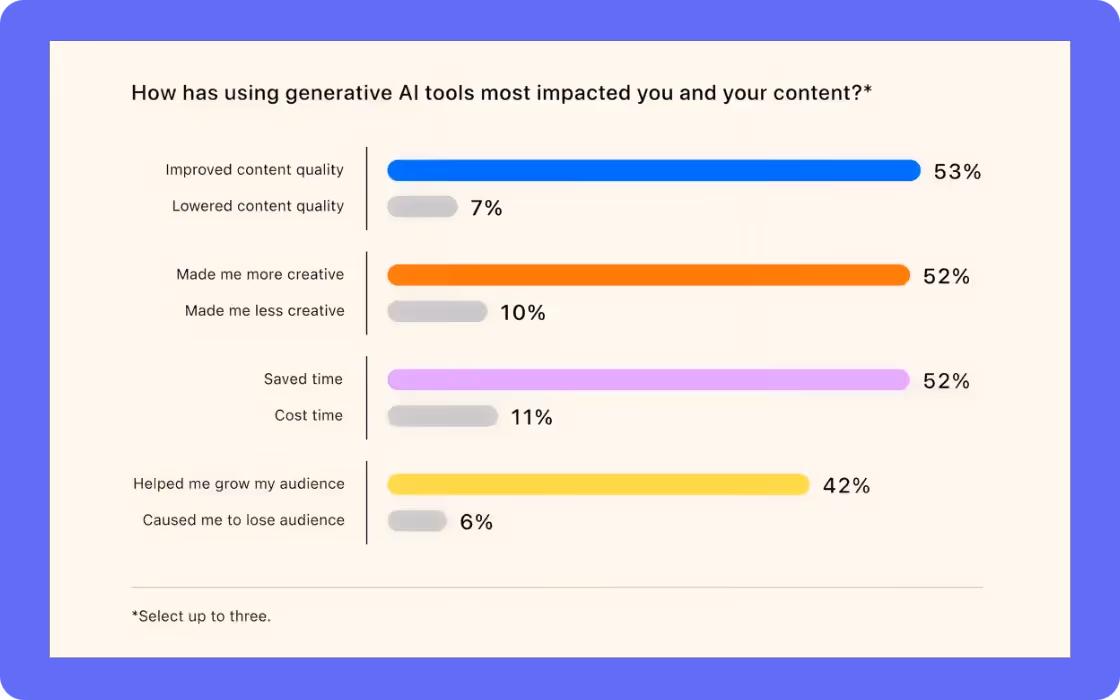
According to a Descript and Ipsos survey of 1,004 podcasters and video creators, “more than half of creators who have used generative AI say it has already made them more creative and improved the quality of their content.”
In fact:
- 53% said AI improved their content quality
- 52% said it made them more creative
Part 4: What are the business metrics?
Marketing leaders want clarity on how content contributes to pipeline, revenue, customer satisfaction, and operational efficiency. The future of content marketing lies in defining and tracking customer-centric and financial metrics that prove real-world value.
Brian Balfour argues that AI forces new measures of success:
“AI enables products to shift from charging for features to charging for results. Rather than paying for access to capabilities, customers pay for verified outcomes: successful customer service resolutions, qualified sales leads generated, or processing time saved.”
Customer-centric measures
The most effective content is aligned with the customer journey and measurable in its ability to deliver value.
That starts with matching search intent.
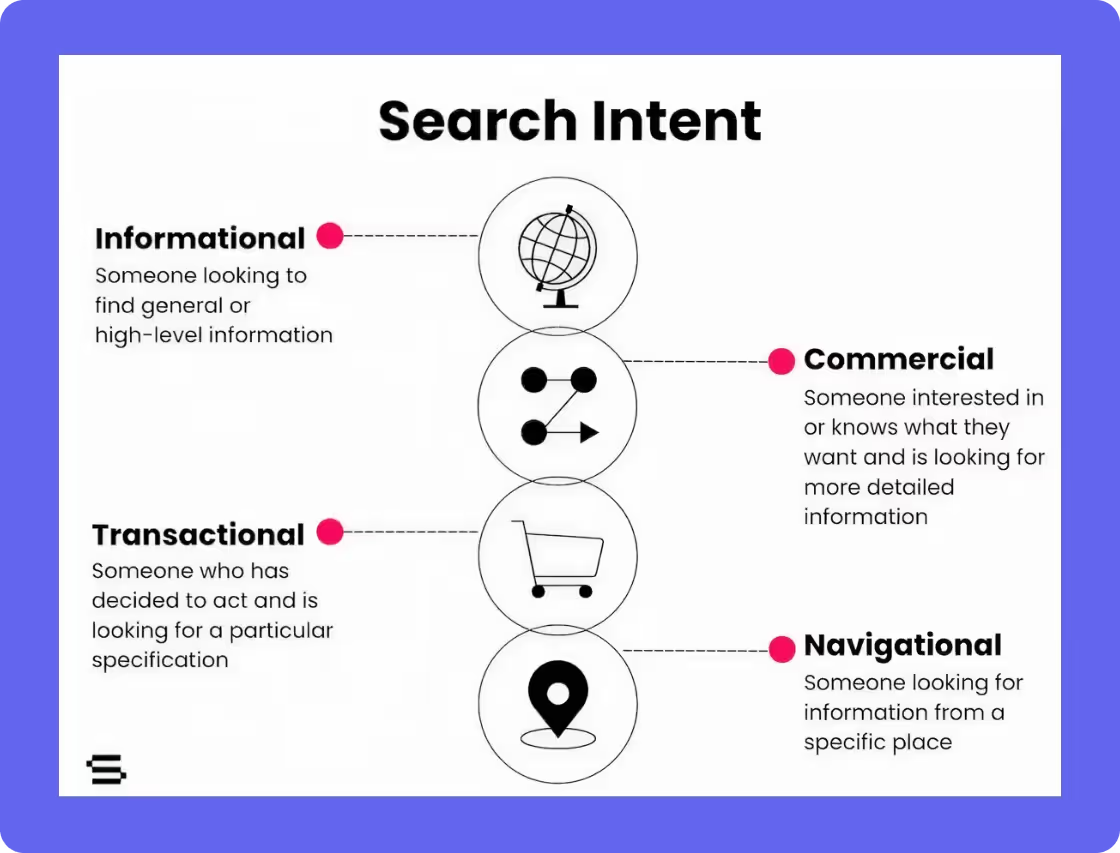
Search intent match rate is a powerful leading indicator of how well your content meets the real needs behind a query. Is the visitor looking for a how-to, a comparison, or a purchase-ready solution?
Equally important is answer accuracy.
Especially in the age of AI-driven summarization and zero-click search, your content must offer clear, factual, and complete answers to user queries. Measuring this requires internal reviews, feedback from subject-matter experts, and in some cases, structured schema to help large language models interpret and surface your answers accurately.
Customer satisfaction scores (CSAT) and support ticket volume are two powerful downstream metrics to measure the real-world utility of your content. When executed well, a high-quality knowledge base or educational blog can reduce the volume of repetitive support tickets, improve onboarding, and enhance customer retention.
As Alex Halliday shared with content agency Animalz: “We often get on calls with customers and they don’t even realize they have treasure troves of usage data.”
This kind of proprietary information—support tickets, product metadata, expert Q&As—forms the bedrock of what Halliday calls “impossible to copy” content. This is the core of what can become “customer-centric” marketing.
Surfacing unique insights is critical to create unique content, that can not be replicated by AI or Large Language Models.
Financial impact
To justify investment and scale, content teams need to translate their work into financial outcomes.
One of the clearest metrics is cost per qualified lead (CPQL). Instead of just measuring lead volume, CPQL ties content performance directly to quality. This is especially critical for B2B and high-ticket businesses where lead quality matters more than sheer quantity.
Another foundational metric is content ROI.
This involves calculating the total investment in a content initiative—including strategy, writing, design, promotion, and tools—against measurable returns such as influenced pipeline, closed-won deals, or product signups.
For recurring content efforts like SEO blogs, ROI may accrue over months or quarters, but having even a directional sense of impact allows for smarter planning and prioritization.
Resource optimization is a more nuanced but equally vital financial metric. It looks at how effectively your team is allocating time and budget—whether through automation, smarter AI workflows, or reducing content rework.
For example, if you’re able to repurpose a single webinar into five high-performing blog posts and a whitepaper, your cost per asset drops and overall impact rises. These types of efficiency gains can free up bandwidth for more strategic, creative, or high-leverage content efforts.
Part 5: How do you implement new metrics?
Translating content operations into measurable business outcomes requires more than just good intentions—it demands disciplined execution.
To turn strategy into results, organizations must establish robust systems for measurement, tracking, and continuous improvement. This section outlines how to implement a performance-driven content infrastructure that integrates seamlessly across marketing, product, and operations teams.
Setting up measurement systems
The foundation of any effective implementation is a well-defined measurement system.
Start by identifying your primary business goals—whether it's generating qualified leads, increasing organic visibility, improving customer satisfaction, or reducing support costs. Then, work backward to define the content metrics that reflect progress toward those goals. This includes both leading indicators (like search intent match rate or engagement rate) and lagging indicators (such as pipeline influenced or customer retention).
Measurement systems should be layered.
At the operational level, track workflow efficiency, production timelines, and review cycles. At the strategic level, measure campaign-level impact, user behavior, and business contribution.
Ensure that tools like Google Analytics, HubSpot, Looker, or custom BI dashboards are properly configured to capture and segment data. Where AI is involved, include model performance tracking and prompt success rates to continuously tune outputs.
Establishing baselines
Before you can optimize, you need to understand where you’re starting. Baselines provide the context necessary to evaluate performance over time.
This means auditing your current content assets, workflows, and output quality.
- How long does it take to go from brief to publish?
- What percentage of published content drives engagement or conversions?
- How much does each asset cost to produce?
These initial metrics may feel raw or even discouraging—but they’re essential for diagnosing bottlenecks and spotting quick wins.
Establishing baselines also ensures alignment across teams. Everyone—from content creators to executive stakeholders—needs a shared understanding of what “good” looks like today, and what “better” could look like in six or twelve months.
Once baselines are in place, they become the benchmark for future experimentation, resource allocation, and strategic planning.
Creating dashboards
To make data actionable, you need to bring it to life.
Dashboards transform abstract metrics into visible, real-time insights that drive decision-making. Each team should have access to dashboards customized to their role: content leads may focus on production velocity and quality scores; growth teams may zero in on conversion rates and lead attribution; executive leadership wants high-level summaries of content ROI and business impact.
Effective dashboards are functional operating systems.
Build them around your key performance questions: What’s working? What’s not? Where are we ahead or behind target? Prioritize clarity, drill-down capability, and up-to-date reporting to avoid vanity metrics and data overload.
The urgency for better measurement systems is only growing.
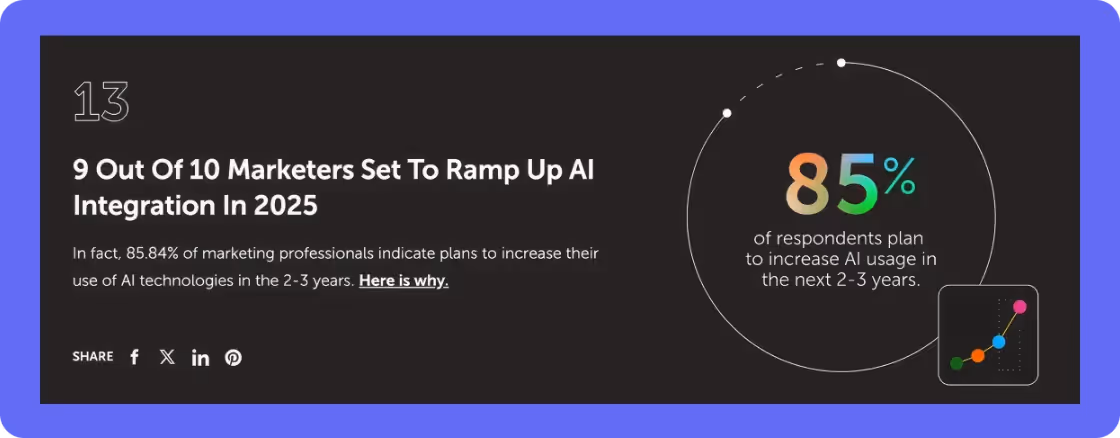
85% of marketers plan to increase their use of AI technologies in the next 2–3 years. As more teams adopt AI to scale content, the ability to track its performance, optimize workflows, and tie results to business outcomes becomes non-negotiable.
Conclusion: Redefining success for AI-first content teams
As AI becomes embedded in every layer of content strategy—from ideation to distribution—traditional metrics fall short. AI-first teams must shift their focus from vanity metrics to measures that reflect real impact: visibility in AI ecosystems, output quality, workflow efficiency, and business outcomes.
New frameworks like Answer Engine Optimization, prompt effectiveness, and AI-human time allocation are not just nice-to-haves—they’re essential to staying competitive in 2025 and beyond. By rethinking how success is defined, measured, and improved, content teams can evolve from reactive publishers into proactive growth engines that are built for the AI era.
If you want to get your content on the path to success, book a call with an AirOps AI content expert today.
Win AI Search.
Increase brand visibility across AI search and Google with the only platform taking you from insights to action.
Get the latest on AI content & marketing

Get the latest in growth and AI workflows delivered to your inbox each week