The Top 7 AI Search Metrics for 2026


- Track visibility with citations, mentions, and AI Overview presence, not CTR alone
- Use impression share to compare AI Overview coverage against competitors
- Estimate AI influence through direct-traffic patterns and on-page engagement
- Use assisted attribution to connect early AI discovery to pipeline outcomes
- Improve citation stability with clean structure, schema, freshness, and original insights
Your content might shape AI answers across ChatGPT, Perplexity, and Google AI Overviews right now, and your analytics dashboard shows nothing.
Traditional metrics like click-through rate and keyword rankings never prepared us for a world where users get answers without visiting a website. AirOps research found that only 30% of brands stay visible from one AI answer to the next, and just 20% remain visible across five consecutive runs. That level of volatility makes one-off checks meaningless and continuous measurement essential.
So marketers face a new question: How do we measure AI Search impact?
The answer requires new metrics. Instead of clicks and rankings, teams need to track citations, brand mentions, and visibility inside AI-generated responses.
This guide explains the seven AI Search metrics that matter most in 2026, how to track them, and what actions improve your performance.
Why traditional SEO metrics fall short in AI Search
Most SEO measurement assumes one thing: a user clicks.
Click-through rate, keyword rankings, and organic traffic volume all depend on a visit to your site. AI answer engines break that assumption.
Users now ask a question and read the answer directly in ChatGPT or Google AI Overviews. They often never open a page at all.
That shift makes classic metrics unreliable. Teams need AI search performance metrics designed for a world where influence happens without a click.
Here’s why:
Click-through rate becomes misleading: Users get complete answers without clicking. Organic CTR often drops sharply when AI Overviews appear.
Keyword rankings lose meaning: AI platforms synthesize across multiple sources instead of rewarding a single page position.
Traffic volume hides real influence: Your content can inform an AI answer even when visits decline.
Your content can shape the answer buyers read, even when traffic stays flat. This disconnect makes legacy measurement approaches unreliable for understanding actual search performance. Teams need a measurement model built for AI Search instead of blue links.
What visibility means now
As AI summaries replace traditional results, marketers need to rethink how they define success. Aleyda Solis captured this shift well in a recent AirOps webinar:
“SEOs must rethink how they measure success — AI Overviews change what visibility looks like.” — Aleyda Solis
That change in visibility is exactly why clicks and rankings no longer tell the full story. AI Search demands metrics that measure influence, presence, and citations instead of traffic alone.
What AI Search visibility means for your brand
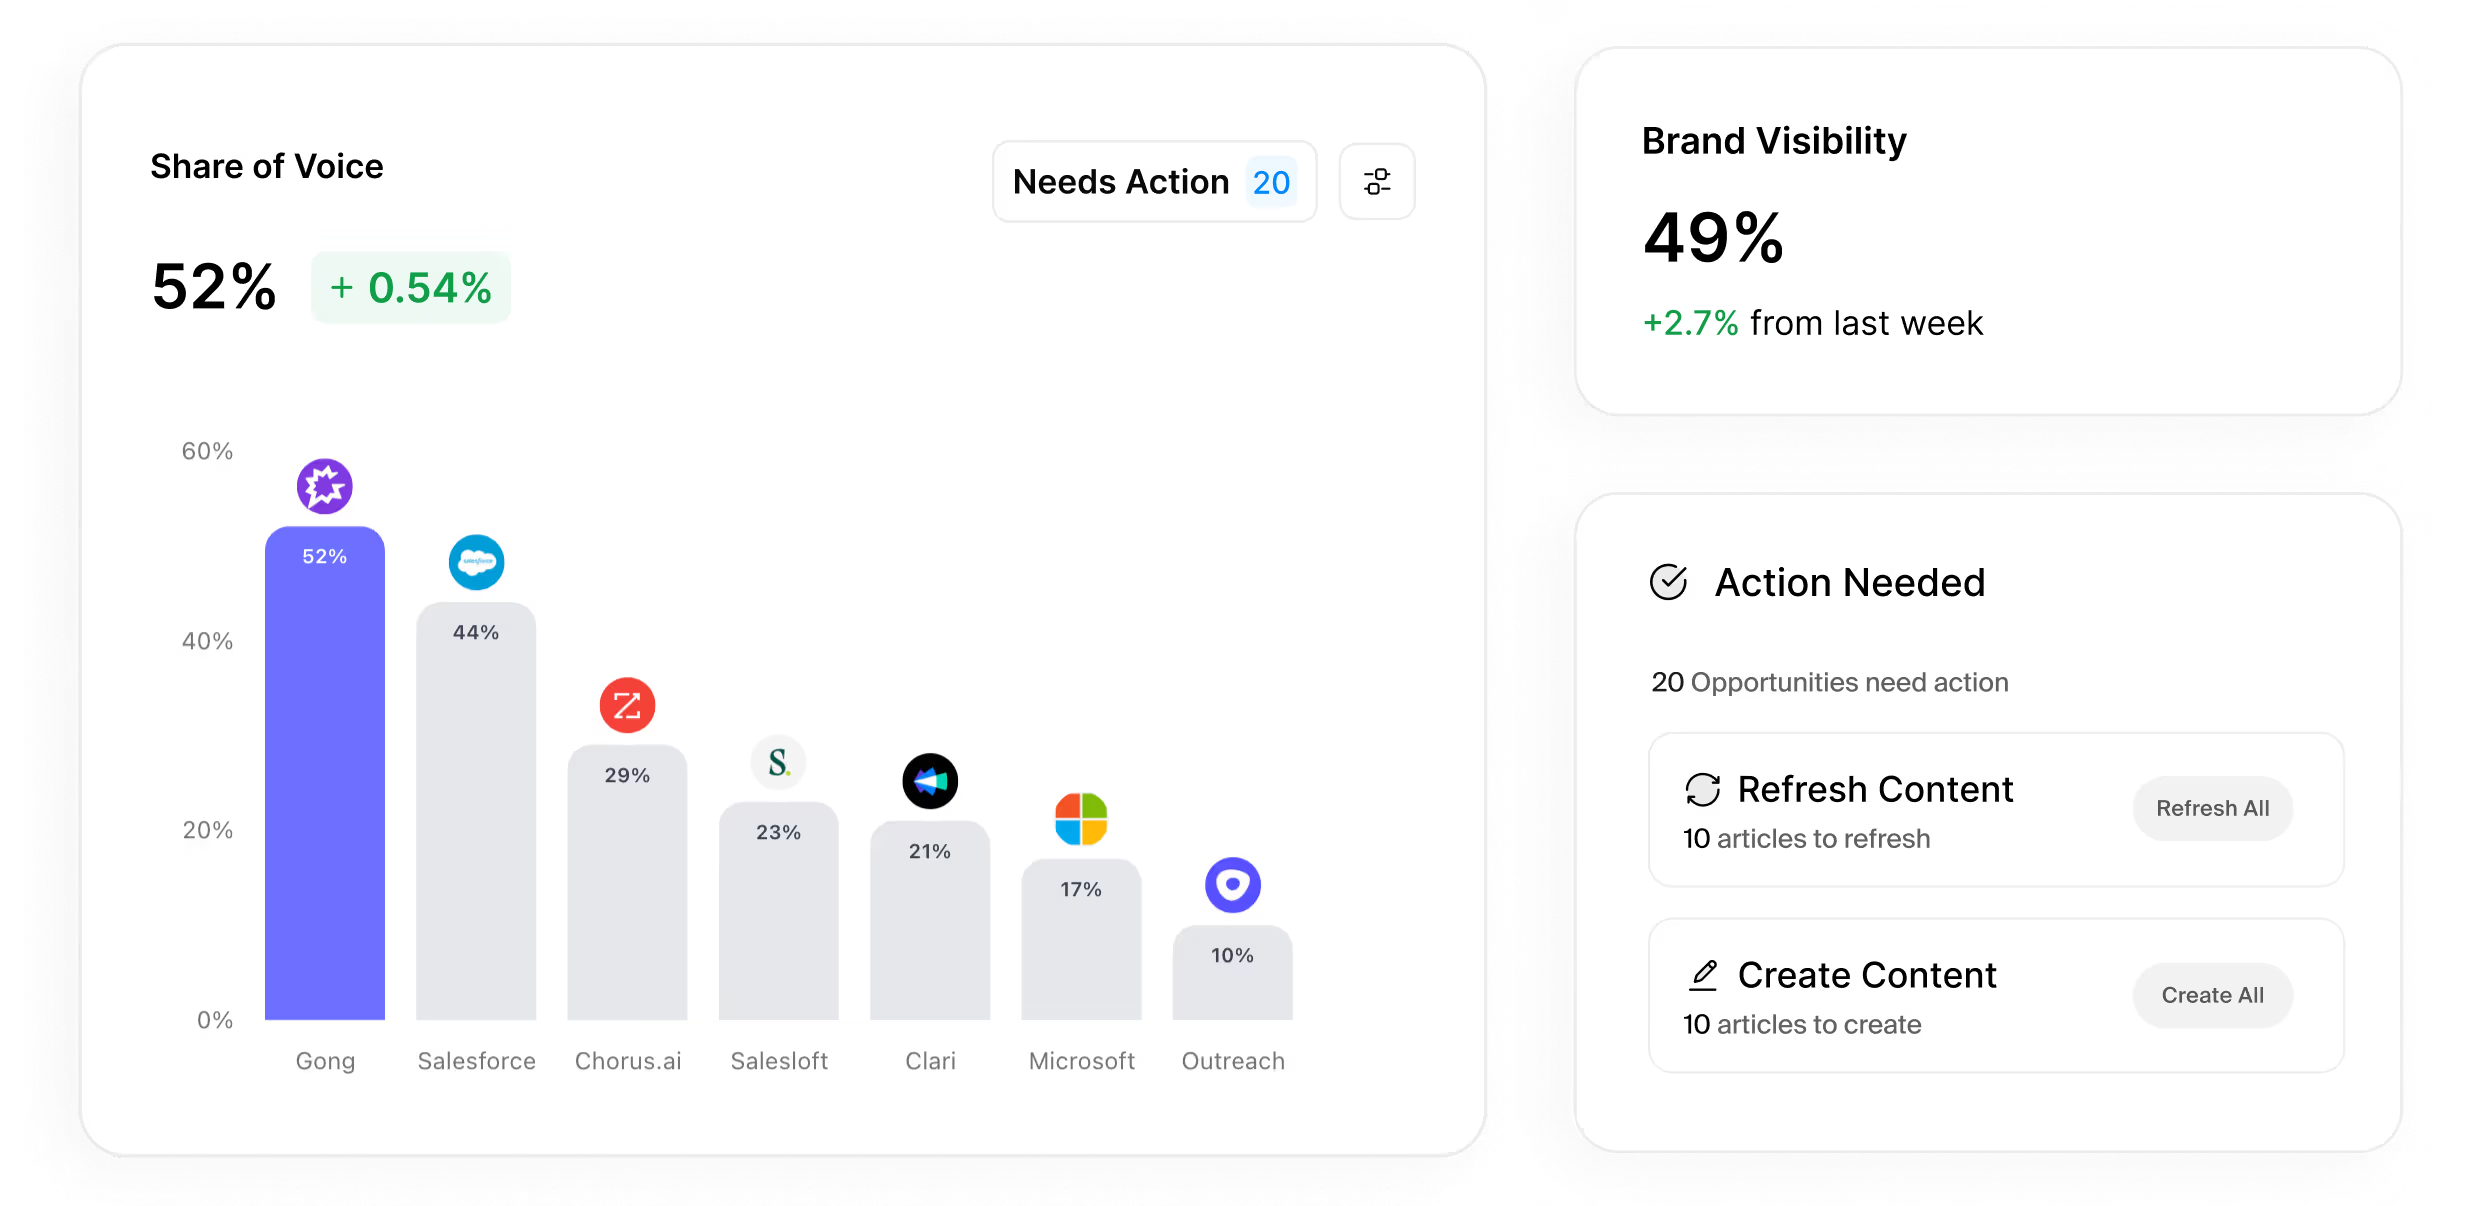
AI search visibility describes how often and how prominently your brand appears inside AI-generated answers. Sentiment Tracking adds a critical dimension: it measures how AI models characterize your brand (positive, neutral, or negative), not just whether they mention it. Citations Matrix maps which sources compete for the same prompts, so you can see exactly who shows up alongside you in every answer. AI search analytics tools now make it possible to measure these signals at scale, across hundreds of queries.
AI search visibility behaves differently from classic SERP visibility.
Think about common buyer behavior.
When someone asks ChatGPT for product recommendations in your category, does your brand appear?
When Google AI Overviews summarize information about your industry, do they cite your content?
Those moments define AI Search’s impact.
The 7 AI Search metrics that matter most
The following seven metrics create a practical framework for measuring AI Search performance. Together, they capture visibility, influence, and downstream business impact. Use these metrics to spot real trends and ignore noise.
1. Citation frequency across AI platforms
Citation frequency measures how often AI systems reference your content in responses to relevant queries. This is the clearest signal of AI Search authority.
When citation frequency rises, AI platforms treat your brand as a trusted source on that topic.
Track this metric by:
Running priority queries in ChatGPT, Perplexity, and Google AI Overviews
Recording when your brand or content appears
Comparing results week over week
Higher citation frequency means your content shapes more answers. LLM brand citation tracking gives teams visibility into how this signal changes over time.
Consistency matters more than any single snapshot. Aja Frost, VP of AI Growth at HubSpot, found that half of cited pages change every single month on average, and nearly six in ten appear once and vanish the next month (AirOps webinar).
AirOps research confirms that 40% of pages that lose visibility can resurface with timely updates. AI citation tracking over weeks and months reveals the real trend behind volatile snapshots.
2. Brand mention visibility in AI answers
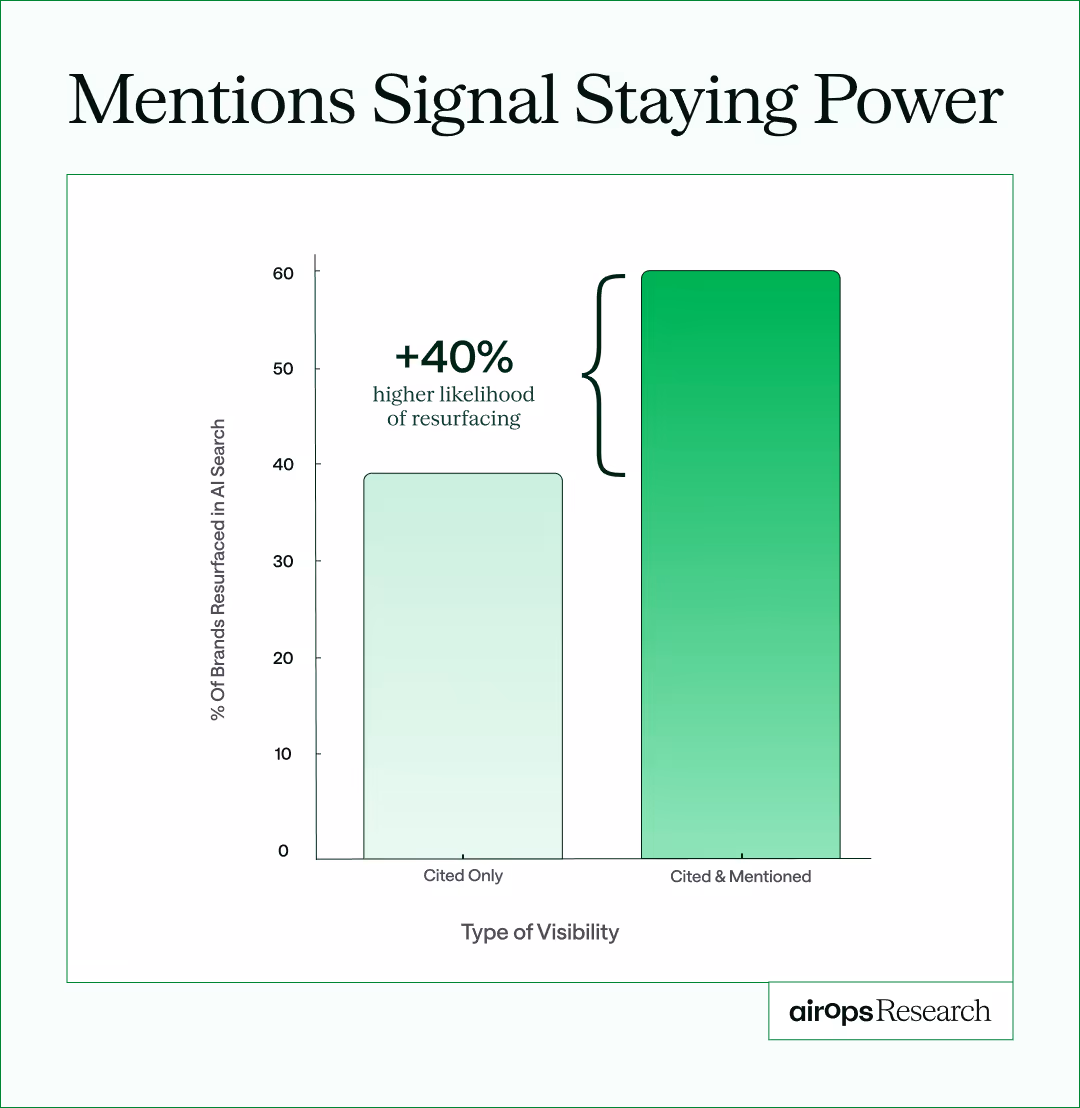
Brand mentions capture references to your company even when no link appears. Think of citations as sourced proof and mentions as general brand presence. Track both because AI platforms surface them in different ways.
Mentions build awareness and shape perception long before a click happens. An AI answer might say, “Tools like AirOps help marketers track AI visibility.” That single sentence can influence a buyer, yet analytics never record a visit. AI visibility tracking captures these otherwise invisible touchpoints.
This metric uncovers the impact that traditional dashboards miss. AirOps research shows brands that earn both citations and mentions are 40% more likely to resurface across multiple AI answers than citation-only brands. Mentions help stabilize visibility when results shift from one run to the next.
3. Search impression share in AI Overviews
Search impression share tracks how often your content appears in Google AI Overviews compared to competitors.
AI Overviews now show for a significant portion of commercial queries. Visibility here matters.
Calculate impression share like this:
Identify 100 high-value queries
Count how often AI Overviews appear
Measure how many times your brand gets cited
If your content appears in 15 of those 100 answers, you hold a 15% share.
Track this number over time to measure competitive progress.
4. Engagement beyond click-through rate
When users do click through from AI sources, behavior signals become important.
Pay attention to:
Time on page
Scroll depth
Pages per session
Repeat visits
AI-referred users often arrive with a strong intent. They already read a summary and want depth.
Higher engagement from these visitors shows your content adds real information gain beyond the AI answer.
An AI search performance tracker that combines citation data with on-site engagement signals gives you a complete picture of how AI-referred visitors interact with your content.
5. AI referral traffic and dark traffic attribution
Many AI-driven visits arrive without a clear referral source. Analytics tools often categorize this activity as direct traffic, even when an AI answer influenced the visit.
You can estimate AI-driven visits by analyzing behavior patterns:
Visitors land on deep content pages instead of the homepage
Sessions show longer time on page
Behavior matches high-intent research activity
These patterns help separate true direct traffic from AI-influenced visits.
6. Assisted conversions from AI sources
AI rarely acts as the final touchpoint. More often, it influences early research before a later conversion.
Assisted conversion tracking captures that value.
A buyer might:
Discover your brand in ChatGPT
Research further through Google
Convert weeks later via branded search
Without assisted attribution, you credit only the last step and miss AI’s role. Multi-touch models help you measure the full journey.
Kyle Poyar, founder of Growth Unhinged, reports that leads arriving through LLM referrals convert at two to six times the rate of any other lead source (AirOps webinar recap).
7. Content authority signals
AI systems choose sources the same way people do. They look for trust, clarity, and credibility. These AI search evaluation metrics help you diagnose which authority inputs need strengthening.
Authority signals help determine whether your content earns citations. Factors like backlink quality, author expertise, content freshness, and structured data all shape how AI platforms evaluate a page.
Structure plays an outsized role. AirOps analysis shows pages with clean organization and schema earn 2.8× more AI citations than poorly formatted pages.
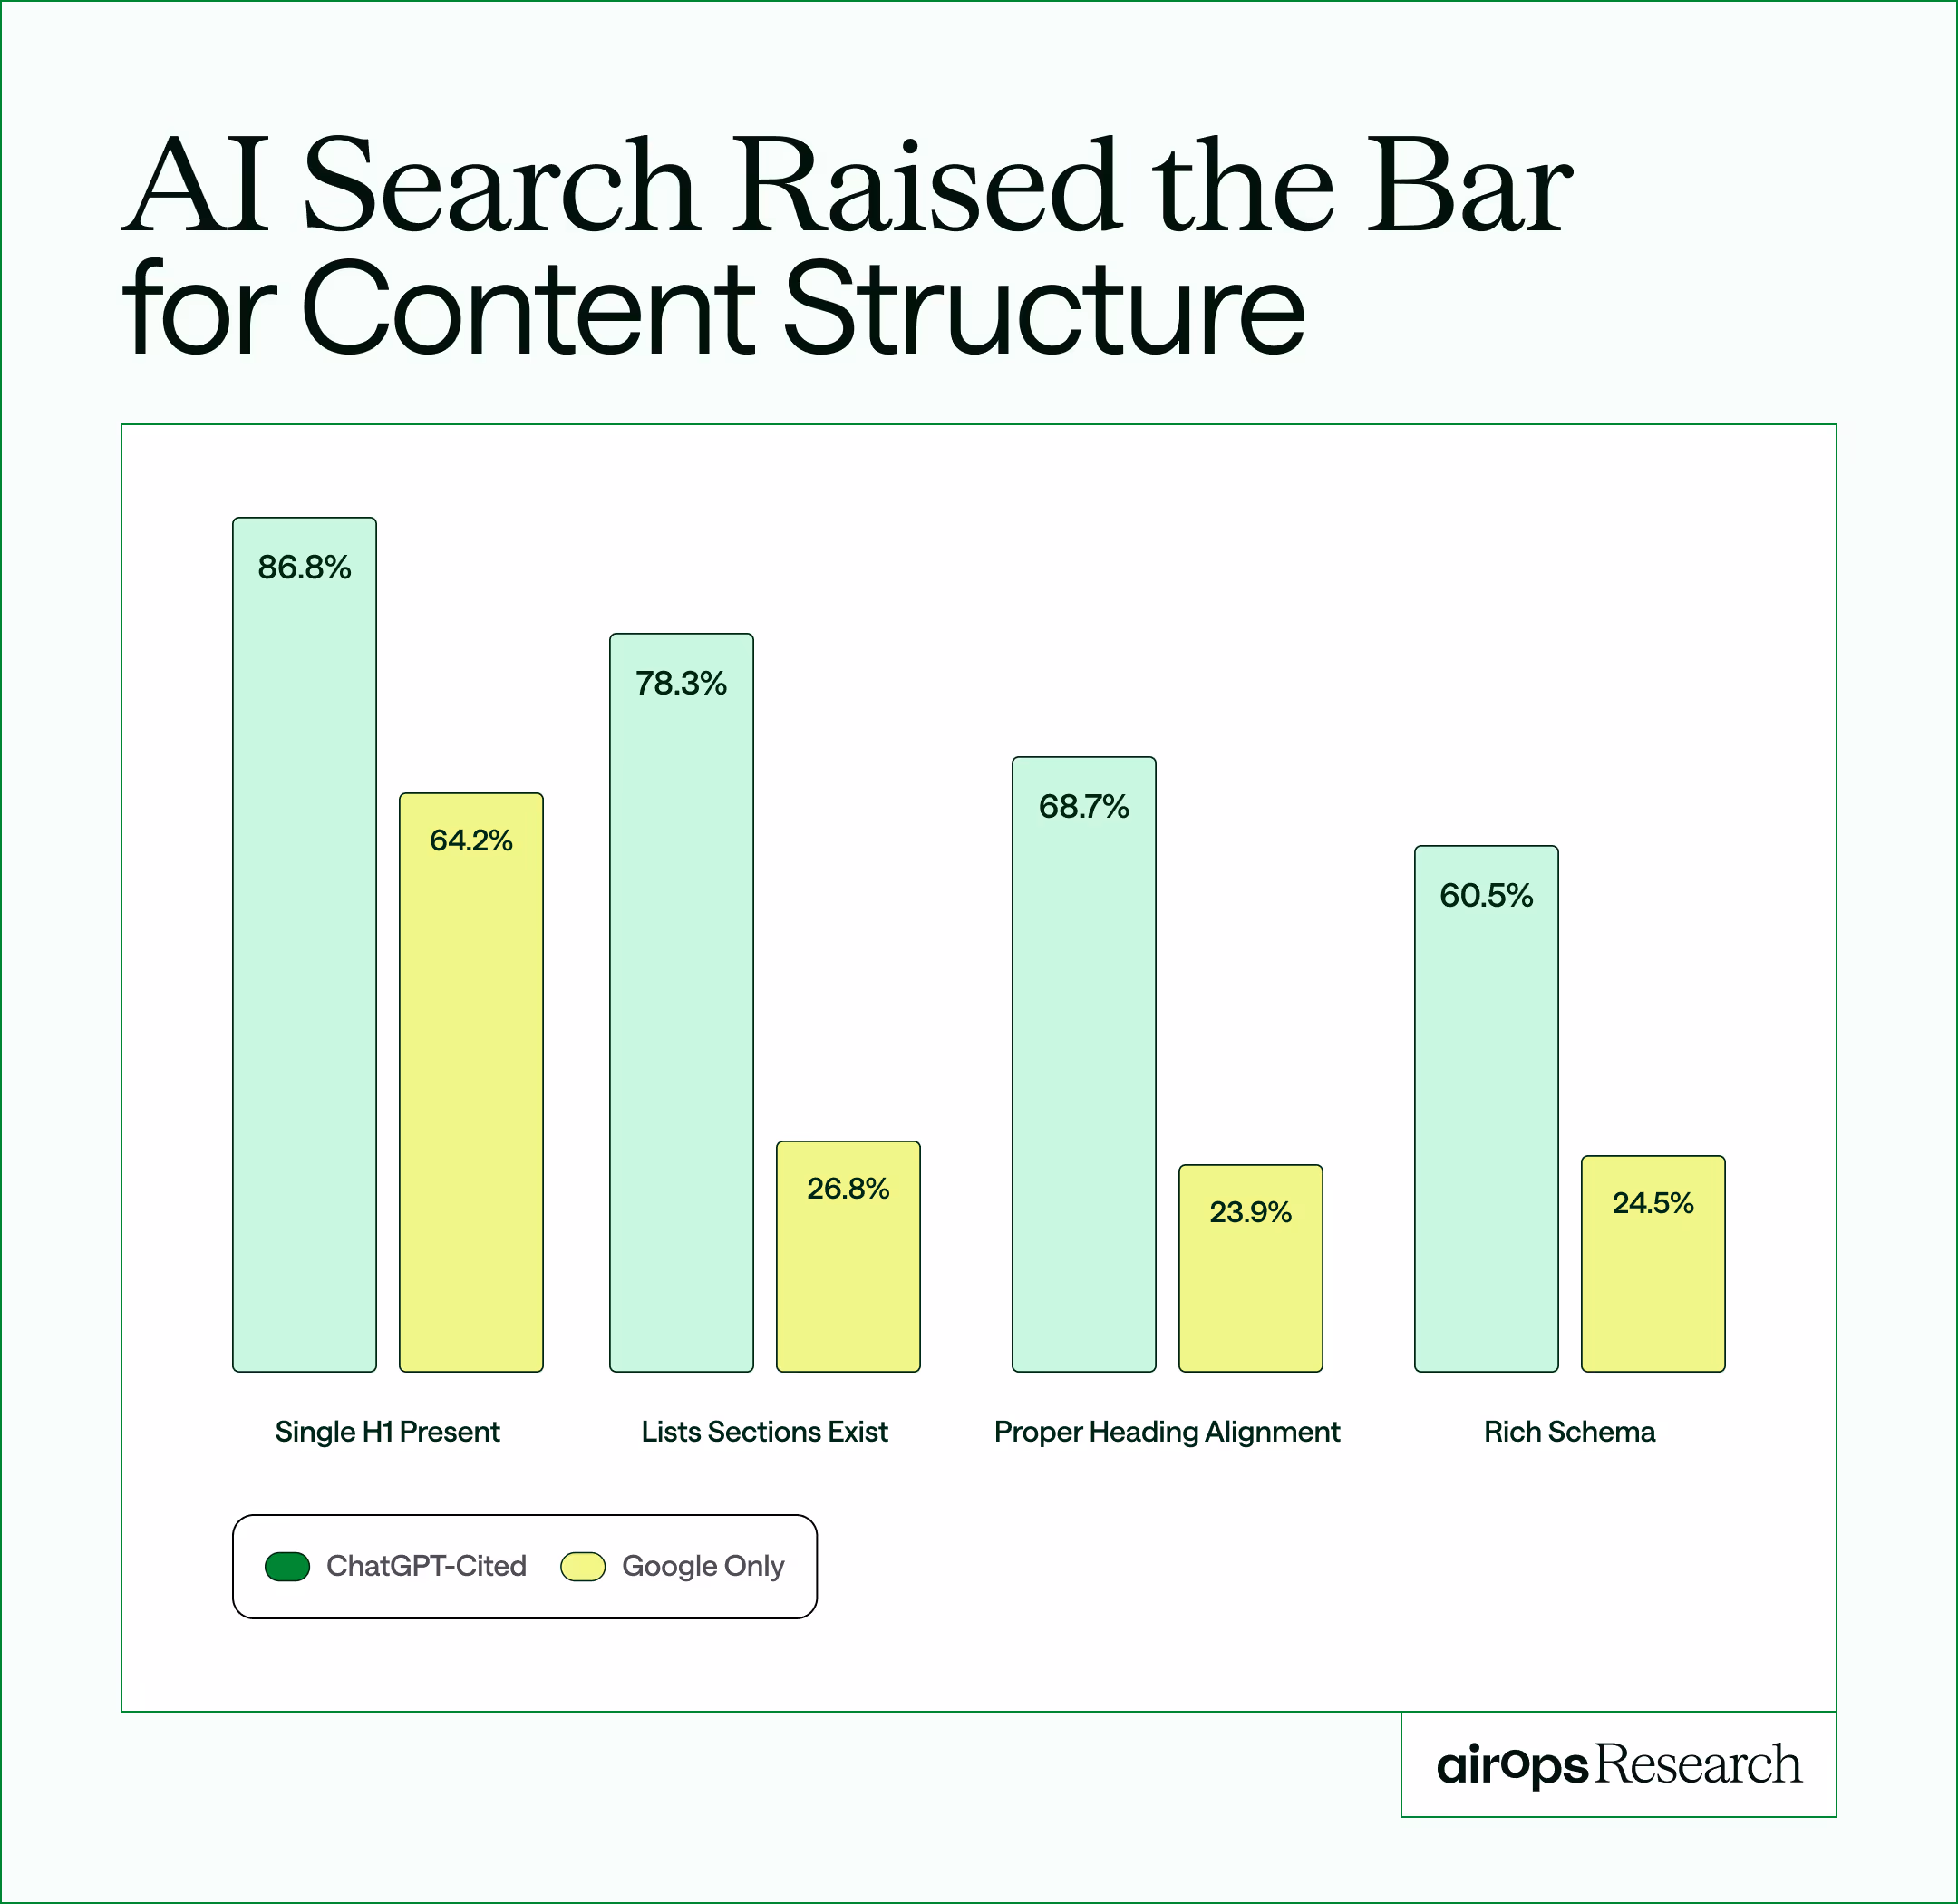
You can’t see exactly how AI models weigh each signal, but you can control the inputs. Strengthen your backlink profile, clarify author credentials, keep key pages updated, and add relevant schema markup. Small improvements across these inputs tend to improve citation stability over time.
How to organize your AI search metrics into a measurement framework
Tracking seven metrics is useful, but organizing them into a structured framework makes them actionable. Mike King, founder and CEO of iPullRank, recommends stratifying AI search measurements into three tiers (AirOps webinar).
Performance metrics
These sit at the top of the framework and connect directly to business results. Referral traffic from AI sources, assisted conversions, and pipeline influence all belong here. Performance metrics show whether AI search drives revenue.
Channel metrics
Channel metrics measure your brand’s position within AI answer engines. Citation rate, mention rate, share of voice, and sentiment all fall into this tier. They tell you how visible and how well-regarded your brand is across ChatGPT, Perplexity, and Google AI Overviews.
Input metrics
Input metrics track the signals that determine whether AI platforms choose your content in the first place. Passage relevance, page speed, bot crawl activity, and structured data quality all qualify. King notes that real-time page requests from AI systems mean slow-loading pages get skipped entirely (AirOps webinar).
This three-tier structure helps teams prioritize. Start by reviewing performance metrics to confirm business impact. Then use channel metrics to diagnose visibility gaps and input metrics to pinpoint what to fix.
AirOps Insights maps directly to this framework, tracking channel metrics like citation rate and mention rate while surfacing the input signals that drive them.
How to collect and measure your AI Search performance
Measurement doesn’t require perfect data. Track consistent signals that show whether visibility rises or drops.
Below are practical, low-friction methods to capture those signals.
Track citations in ChatGPT and Perplexity
Start with a repeatable habit instead of a complex system.
Pick a focused list of questions that matter to your business and check them on a regular cadence. Run those queries across the major AI platforms and take note of which brands appear in the answers. Over time, patterns emerge. You start to see where your content gains traction and where competitors dominate.
This hands-on approach works well for small programs or early experiments. When the scope grows larger, automation becomes essential. Many teams use modern AEO (Answer Engine Optimization) tools like AirOps Insights to monitor citations across hundreds or thousands of queries, compare visibility across ChatGPT, Perplexity, and Google AI Overviews, and surface changes without manual searching.

Monitor brand mentions in real time
Citation tracking tells only part of the story. Brand mentions fill in the rest.
Set up monitoring alerts so you know whenever AI answers reference your company. Combine that automated tracking with occasional manual reviews to catch nuance that tools sometimes miss.
Context matters more than raw counts. Ask questions like:
Does the AI recommend your brand or simply list it?
Do mentions appear alongside strong competitors?
Is the tone positive, neutral, or skeptical?
A thoughtful review of mention quality often reveals more than a simple tally.
Identify dark traffic from AI sources
AI-driven visits rarely arrive with clean referral tags. Instead, they often appear as direct traffic in analytics tools.
To estimate the real impact, look beyond channel labels and focus on behavior. Certain patterns strongly suggest an AI-influenced visit. A user lands directly on a specific article rather than your homepage. The session shows longer time on page and deeper scrolling. Navigation reflects research intent instead of casual browsing.
These clues help you separate true direct visitors from people who found you through an AI answer.
At scale, this analysis becomes hard to manage manually. Some teams use AirOps to combine citation trends with analytics signals so they can estimate AI influence without building complex custom reports.
Connect AI visibility to revenue
Visibility becomes meaningful when it ties back to business outcomes.
Rather than treating AI as a single touchpoint, view it as part of a longer journey. A buyer might first encounter your brand in a ChatGPT answer, return later through a Google search, and convert days after that. Good attribution models recognize those early interactions instead of crediting only the final click.
When you connect citations and mentions to assisted conversions and pipeline movement, AI Search shifts from an interesting trend to a measurable growth channel.
Best tools for AI Search measurement
Effective AI Search programs combine a few focused tool types:
AI visibility trackers to monitor citations across ChatGPT, Perplexity, and Google AI Overviews
Brand mention monitoring to capture unlinked references and sentiment
Attribution analytics to estimate dark traffic and assisted conversions
Content audit tools to evaluate structure, authority signals, and AI readiness
AirOps consolidates these tool types so teams can monitor AI visibility and prioritize updates without jumping between dashboards.
How to improve your AI Search metrics
Measurement matters only when it leads to better decisions. The goal is not to collect dashboards. The goal is to change what you create and how you publish.
Here are practical ways to turn AI Search data into real improvement.
1. Audit your current AI visibility baseline
Start with a simple snapshot of reality.
Choose 20 to 30 high-value queries that represent your core topics. Run those searches across ChatGPT, Perplexity, and Google AI Overviews. Write down where your brand appears, where competitors show up instead, and which questions produce no visibility at all.
This quick exercise usually reveals two things right away. You find a handful of easy opportunities to win citations. You also uncover major gaps that require deeper content work.
A baseline audit gives you a clear starting line instead of vague assumptions.
2. Structure content for AI retrieval
AI systems favor clarity and directness.
Pages that earn citations tend to share common traits. They use simple headings that mirror real questions. They answer those questions in plain language instead of long introductions. Paragraphs stay short and focused enough to quote cleanly.
Think at the paragraph level when you write or update content. Each section works best when it can stand alone as a complete answer.
Small structural changes often produce big visibility gains.
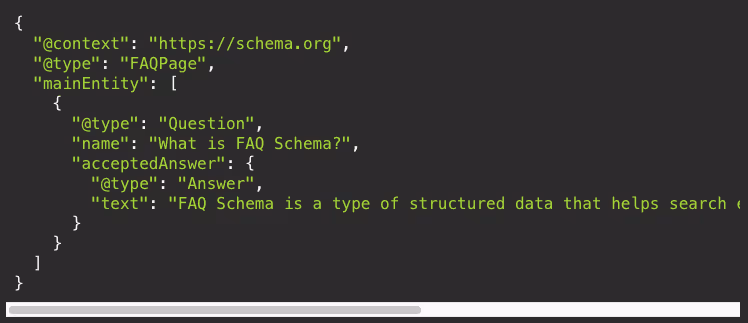
FAQ Schema example
∅
3. Add schema markup for AI crawlers
Schema acts as a map for AI crawlers.
Structured data helps AI platforms understand what your content covers and how pieces fit together. FAQ schema highlights question-and-answer sections. HowTo schema clarifies step-by-step instructions. Article schema provides context about authorship and topics.
These signals do not guarantee citations, but they make your pages easier for AI systems to interpret and trust.
4. Build authority through original research
AI platforms prefer sources they cannot easily replace.
Generic summaries rarely earn attention. Unique information does. Brands that publish data studies, surveys, expert analysis, and proprietary frameworks (like AirOps!) consistently attract more citations.
Original insights give AI answers something concrete to reference. They also separate your content from the mass of look-alike articles on the same topic.
If you want durable AI visibility, invest in work only you can produce.
5. Monitor performance and adjust weekly
AI Search changes fast. Measurement must keep up.
Review a focused set of signals on a regular cadence. Check citation frequency for priority topics. Track how often your brand appears in AI Overviews. Watch shifts in mentions and context to spot emerging trends.
Freshness plays a major role in staying visible. AirOps research found more than 70% of pages cited by AI were updated within the last 12 months. Regular refresh cycles give your content a stronger chance to remain part of AI answers.
Use what the data tells you. Pages earning citations signal a working format, so publish more content in that same structure. Pages losing visibility need a timely update before a competitor claims the gap.
Consistent monitoring gives your team a clear, repeatable process for improving AI search performance.
Example workflow to put this into practice
A practical weekly routine might look like this:
Check citation changes for 25 priority queries
Review new brand mentions for tone and context
Update two pages that lost visibility
Publish one new AI-optimized answer page
Simple habits like these turn AI Search improvement into a predictable process.
How to set benchmarks for AI Search success
Benchmarks give AI Search programs a clear definition of progress. Focus on relative improvement instead of chasing perfect scores.
Document your current citation frequency and brand mentions
Measure how often you appear compared to direct competitors
Set realistic quarterly growth targets
Reassess benchmarks as AI platforms change
If you currently appear in 5% of relevant AI queries, growing to 10% represents meaningful progress regardless of what competitors achieve.
How leading brands win visibility in AI Search
Brands succeeding in AI Search share common patterns in their approach.
Prioritize citability: Create content specifically designed to be quoted by AI systems
Invest in expertise signals: Build author profiles and demonstrate topical authority
Monitor continuously: Track AI visibility as actively as traditional rankings
Adapt content formats: Test Q&A structures, summaries, and data tables that AI platforms prefer
AI visibility platforms can speed up monitoring and make gaps easier to spot than a purely manual process.
Frequently asked questions about AI search metrics
What are AI search metrics?
AI search metrics measure how your brand appears inside AI-generated answers. They include citation rate, brand mention visibility, AI referral traffic, and assisted conversions. These metrics capture influence that happens before or without a visit to your site.
How do you measure AI search performance?
Start by running priority queries across ChatGPT, Perplexity, and Google AI Overviews. Track which answers cite or mention your brand and compare results over time. Tools like AirOps Insights automate this process across thousands of queries and multiple AI platforms.
Which AI search metric matters most?
Citation rate is the clearest direct signal of AI search authority because it measures exactly how often AI platforms select your content as a source. Pair it with brand mention visibility to capture influence that citations alone miss.
How often should you check AI search metrics?
Weekly reviews work well for most teams. AI search results shift faster than traditional rankings, so monthly checks miss important changes. Focus on a consistent set of 20 to 30 priority queries and track trends rather than individual snapshots.
Turn AI Search data into a repeatable system
Measuring AI Search impact starts with simple steps. Run a focused set of queries across ChatGPT, Perplexity, and Google AI Overviews. Document where your brand appears, compare results to competitors, and track changes over time.
Those small actions create a clear baseline. From there, you can improve citability, strengthen authority signals, and connect AI visibility to real business outcomes.
AirOps makes this process practical instead of manual. The platform helps teams track citations, monitor brand mentions, and spot content gaps across major AI platforms in one place. Instead of piecing together spreadsheets and guesswork, you get a structured view of what works and what needs attention.
Treat AI Search as a trackable channel, then improve it with the same discipline you bring to SEO: measure, refresh, and publish on a steady cadence.
AirOps for AI Search Metrics
AirOps connects citation tracking, mention monitoring, and content gap analysis across ChatGPT, Gemini, Perplexity, and Google AI surfaces in one dashboard.
Prompt Discovery surfaces the questions your audience actually asks AI search engines, drawn from panel data across millions of real users, so your team can prioritize content updates based on real demand instead of guesswork.
Book a free AEO audit to see where your brand stands across AI search surfaces.
Get the latest on AI content & marketing

Get the latest in growth and AI workflows delivered to your inbox each week
.avif)